
Shoe Carnival (SCVL) Q3: Same-Store Sales Decline Narrows, Challenging Bearish Demand Narrative
Shoe Carnival (SCVL) just posted Q3 2026 results with revenue of about $297 million and EPS of roughly $0.54, while net income came in at around $14.6 million and same store sales growth was a negative 2.7%, setting a cautious tone for the quarter. The company has seen quarterly revenue move from about $306.9 million and EPS of roughly $0.71 in Q3 2025 to $297.2 million and $0.54 in Q3 2026, with trailing 12 month revenue holding just above $1.1 billion and EPS a little over $2.12, so investors are likely to focus on how management defends margins as they weigh the latest print against future growth potential.
See our full analysis for Shoe Carnival.With the numbers on the table, the next step is to see how this earnings picture lines up against the most popular narratives around Shoe Carnival, highlighting where the story is confirmed and where expectations might need a reset.
See what the community is saying about Shoe Carnival
Same Store Sales Slide Is Easing
- Same store sales fell 2.7% in Q3 2026, an improvement from the 7.5% decline in Q2 2026 and the 8.1% decline in Q1 2026.
- Consensus narrative points to pressured lower income shoppers and heavier inventory as risks, yet the sequential improvement in comparable sales
- contrasts with concerns that discount driven traffic could keep comps deeply negative, as the year to date trend shows smaller declines each quarter,
- and suggests inventory and pricing actions may be stabilizing store performance even while demand from more budget conscious customers remains soft.
Margins Under Pressure, But Still Profitable
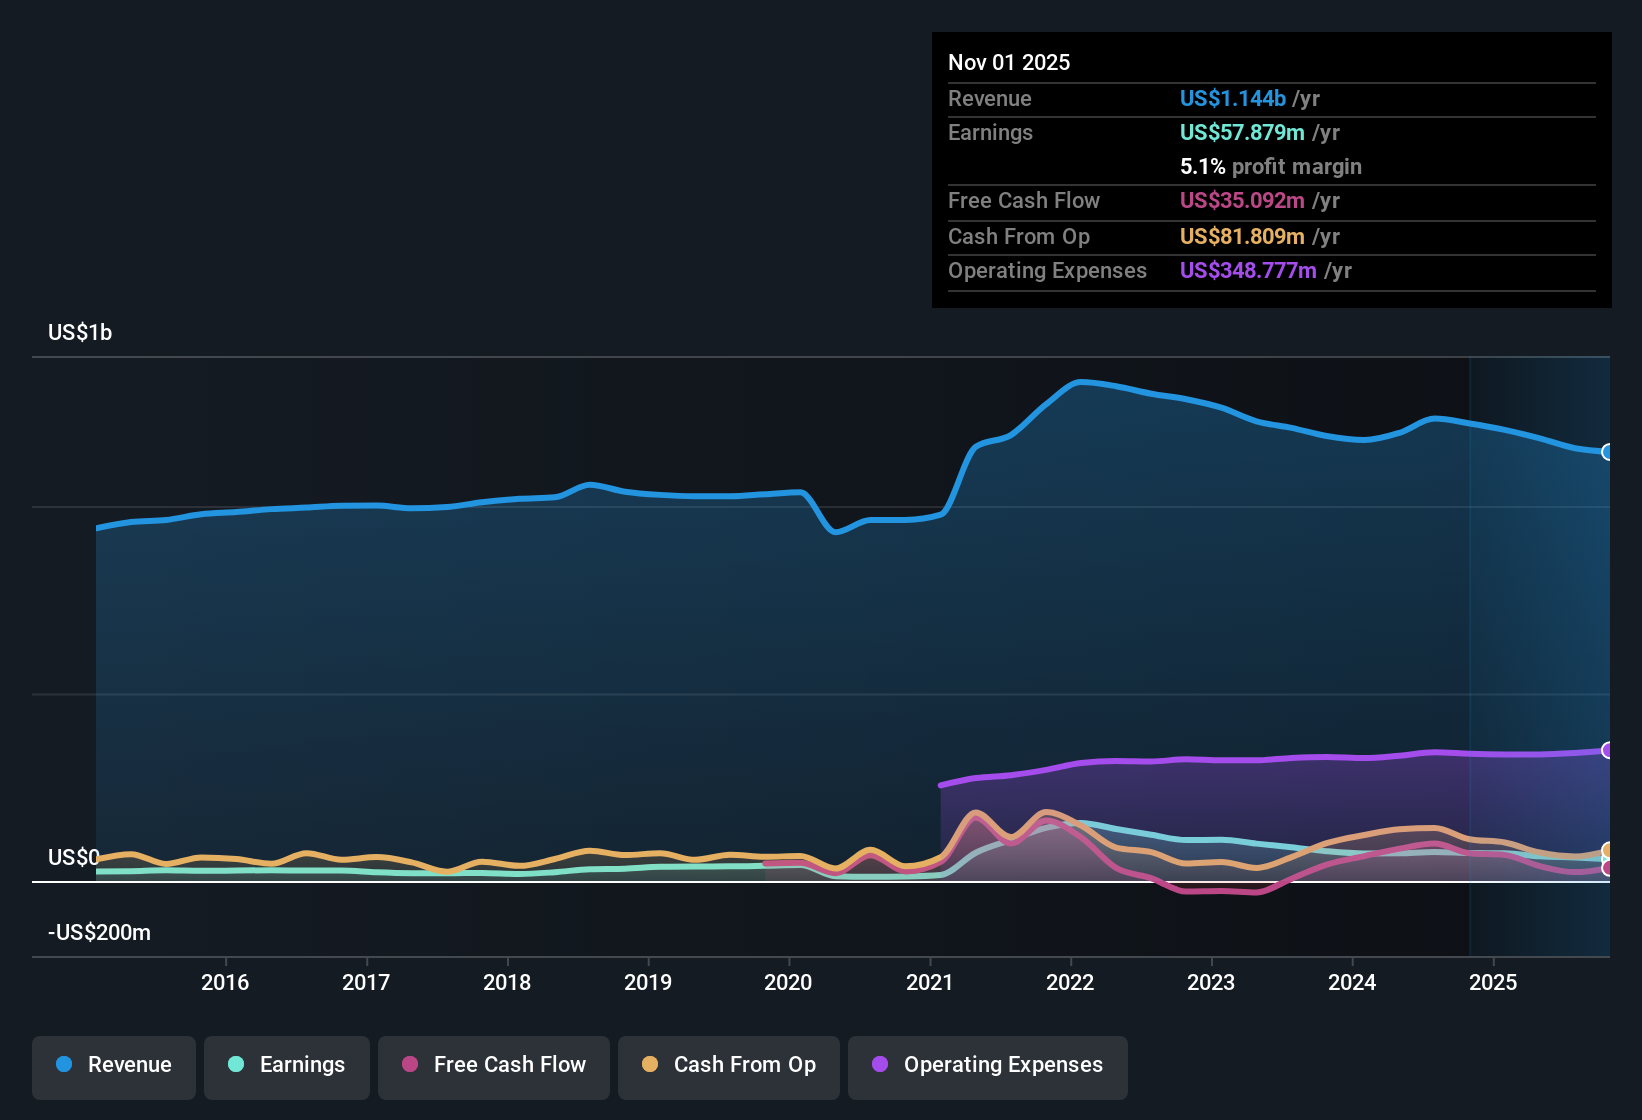
- On a trailing 12 month basis, net profit margin is 5.1%, down from 6.1% a year earlier, while trailing net income has slipped from about $77.2 million to $57.9 million.
- Bears emphasize that earnings are expected to decline about 7.9% per year and that recent heavy inventory could drive more discounting
- which is consistent with the drop in profit margin over the last year and the move from roughly $73.8 million to $57.9 million in trailing net income,
- yet the company remains solidly profitable in the latest quarter with about $14.6 million of net income, giving management room to adjust pricing or costs if demand stays fragile.
Low Multiple Versus DCF Fair Value
- At a share price of $17.54, Shoe Carnival trades on a P/E of 8.3 times compared with the US Specialty Retail industry at 20 times and peers at 31.9 times, and sits well below the $39.94 DCF fair value estimate.
- Bullish arguments that valuation offsets slower growth lean heavily on this gap
- because trailing earnings of about $57.9 million and modest 0.4% annual revenue growth are being priced at a substantial discount to both industry multiples and DCF fair value,
- and the 3.42% dividend yield adds an income component that bulls see as compensating for analysts’ forecast of roughly 7.9% annual earnings declines over the next three years.
Next Steps
To see how these results tie into long-term growth, risks, and valuation, check out the full range of community narratives for Shoe Carnival on Simply Wall St. Add the company to your watchlist or portfolio so you'll be alerted when the story evolves.
See the numbers differently? Use your own take on the data to build a concise, personalised narrative in just a few minutes, Do it your way.
A great starting point for your Shoe Carnival research is our analysis highlighting 3 key rewards and 1 important warning sign that could impact your investment decision.
See What Else Is Out There
Shoe Carnival’s negative comparable sales, sliding margins, and forecast earnings declines highlight a business facing pressured demand, discounting, and limited growth visibility.
If you want steadier performers instead, use our stable growth stocks screener (2089 results) to quickly focus on companies with more consistent revenue and earnings trends that better support long term confidence.
This article by Simply Wall St is general in nature. We provide commentary based on historical data and analyst forecasts only using an unbiased methodology and our articles are not intended to be financial advice. It does not constitute a recommendation to buy or sell any stock, and does not take account of your objectives, or your financial situation. We aim to bring you long-term focused analysis driven by fundamental data. Note that our analysis may not factor in the latest price-sensitive company announcements or qualitative material. Simply Wall St has no position in any stocks mentioned.
Have feedback on this article? Concerned about the content? Get in touch with us directly. Alternatively, email editorial-team@simplywallst.com