
Kraken Robotics (TSXV:PNG): Valuation Check After New Defence Leadership Hires and $12m Contract Wins
Kraken Robotics (TSXV:PNG) just paired fresh leadership firepower with new business wins by appointing veteran executives Kim Butler and Bernard Mills while securing about CAD 12 million in sonar and battery orders from defence focused customers.
See our latest analysis for Kraken Robotics.
Those leadership hires and fresh defence contracts are landing against a backdrop of strong momentum, with a roughly 129.9% year to date share price return and a standout 934.5% five year total shareholder return. This suggests investors are steadily repricing Kraken’s growth prospects and risk profile higher.
If this kind of rerating has you curious about what else is gaining traction in defence and security, it is worth exploring aerospace and defense stocks as a next step.
Yet with the share price already near analyst targets and the stock trading at a premium to some valuation estimates, investors now face a key question: is Kraken still a buy, or is future growth already priced in?
Price to earnings of 111.6x, is it justified?
Kraken Robotics trades at CA$6.00, which implies a steep 111.6x price to earnings multiple, signalling that the market is pricing in aggressive growth versus peers.
The price to earnings ratio compares the current share price to the company’s per share earnings. It is a direct reflection of how much investors are willing to pay today for Kraken’s current profits. For a fast growing, high growth technology name supplying defence and subsea customers, a higher multiple can sometimes indicate confidence that today’s earnings are just the starting point.
Here, however, the premium is substantial, with Kraken valued at 111.6x earnings compared to a peer average of 31.4x and a North American Electronic industry average of 24.6x. Even relative to an estimated fair price to earnings ratio of 51.9x, the current market price suggests investors are assigning a far richer valuation than the level our model indicates the stock could gravitate toward if expectations normalise.
Explore the SWS fair ratio for Kraken Robotics
Result: Price to earnings of 111.6x (OVERVALUED)
However, sustained high expectations face risks if defence spending softens or if Kraken’s rapid revenue and profit growth slows meaningfully from recent double digit rates.
Find out about the key risks to this Kraken Robotics narrative.
Another lens on valuation
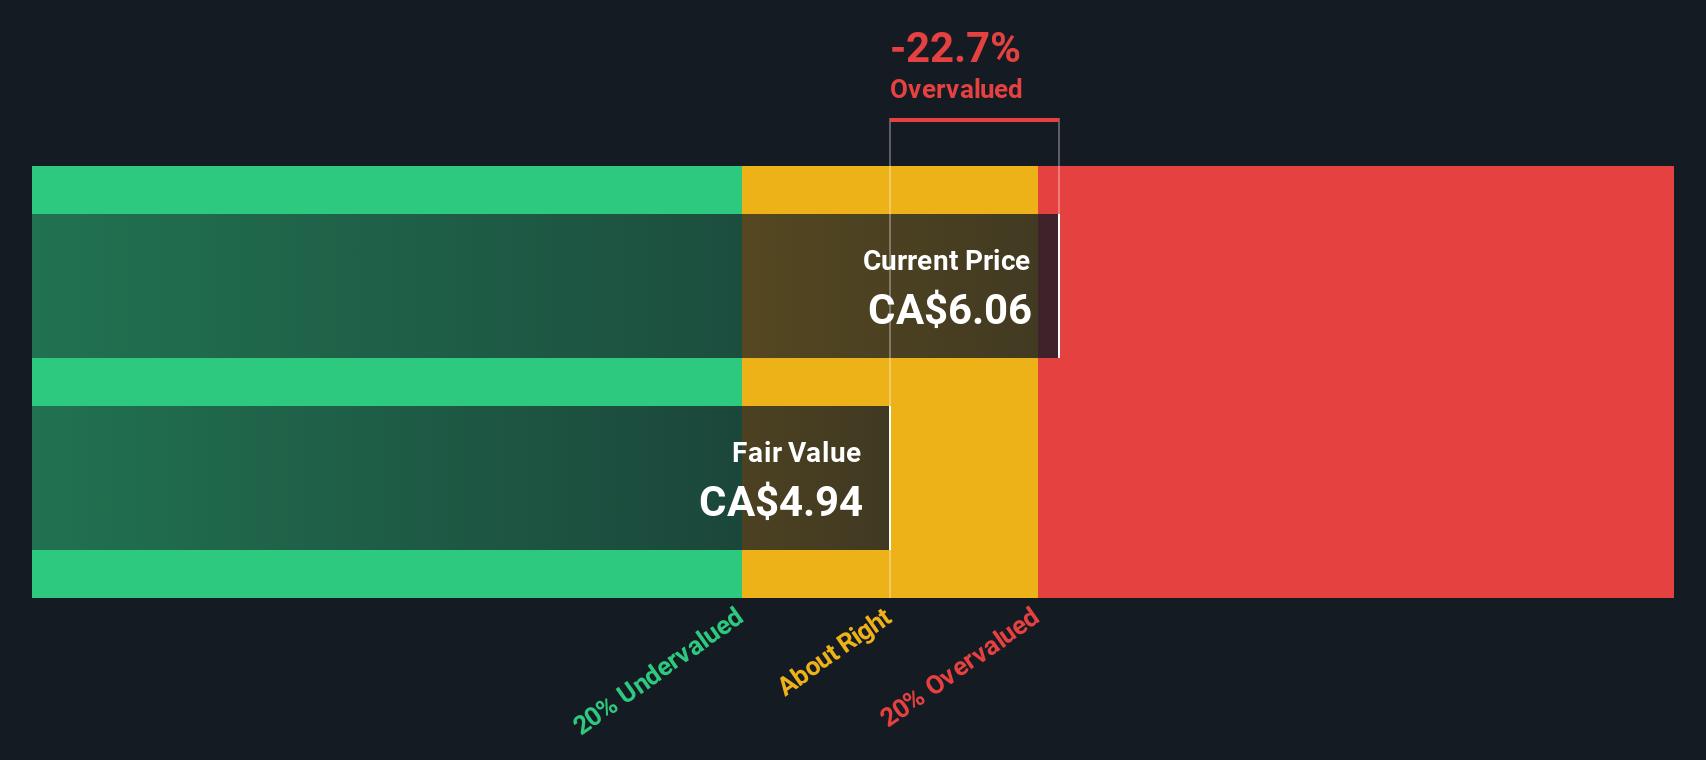
Our DCF model paints a similar picture, with Kraken trading around CA$6.00 versus a fair value estimate near CA$4.80, implying the shares may be overvalued. If both earnings multiples and cash flow point to rich pricing, investors may be paying up too far ahead of the story.
Look into how the SWS DCF model arrives at its fair value.
Simply Wall St performs a discounted cash flow (DCF) on every stock in the world every day (check out Kraken Robotics for example). We show the entire calculation in full. You can track the result in your watchlist or portfolio and be alerted when this changes, or use our stock screener to discover 907 undervalued stocks based on their cash flows. If you save a screener we even alert you when new companies match - so you never miss a potential opportunity.
Build Your Own Kraken Robotics Narrative
If you see the numbers differently or prefer to dig into the data yourself, you can craft a personalised view in just a few minutes: Do it your way.
A great starting point for your Kraken Robotics research is our analysis highlighting 2 key rewards and 2 important warning signs that could impact your investment decision.
Looking for more investment ideas?
Before you move on, put the momentum from Kraken to work by lining up your next opportunities with fresh, data backed ideas from the Simply Wall St Screener.
- Target income focused potential and put your cash to work through these 15 dividend stocks with yields > 3%, offering yields that can help strengthen your portfolio’s long term returns.
- Capitalize on market mispricings by scanning these 907 undervalued stocks based on cash flows, which may trade below their intrinsic value based on future cash flows.
- Ride powerful innovation waves by zeroing in on these 26 AI penny stocks, which could reshape entire industries with real world artificial intelligence applications.
This article by Simply Wall St is general in nature. We provide commentary based on historical data and analyst forecasts only using an unbiased methodology and our articles are not intended to be financial advice. It does not constitute a recommendation to buy or sell any stock, and does not take account of your objectives, or your financial situation. We aim to bring you long-term focused analysis driven by fundamental data. Note that our analysis may not factor in the latest price-sensitive company announcements or qualitative material. Simply Wall St has no position in any stocks mentioned.
Have feedback on this article? Concerned about the content? Get in touch with us directly. Alternatively, email editorial-team@simplywallst.com