
Is It Too Late to Consider Broadcom After Its AI Fueled 119.5% One Year Surge?
- If you are wondering whether Broadcom is still attractive after such a huge run, or if you are late to the party, this article will walk through what the current share price really implies about its value.
- The stock has pulled back about 3.2% over the last week, but it is still up 11.7% over the past month, 68.2% year to date and an eye catching 119.5% over the last year, with multi year gains that would make most blue chips jealous.
- Recent headlines have centered on Broadcom's strategic position in high performance chips for AI infrastructure and data centers, along with growing attention on its software and networking businesses that support hyperscale customers. At the same time, market commentary has increasingly framed Broadcom as a core AI infrastructure play. That helps explain why investors have been willing to pay up despite cyclical risks in semiconductors.
- Despite all that enthusiasm, Broadcom currently scores just 0/6 on our valuation checks, suggesting that by traditional metrics it may not be the bargain some investors expect. Next we will unpack different valuation approaches and, at the end of the article, touch on a smarter way to think about what the market is really pricing in.
Broadcom scores just 0/6 on our valuation checks. See what other red flags we found in the full valuation breakdown.
Approach 1: Broadcom Discounted Cash Flow (DCF) Analysis
A Discounted Cash Flow, or DCF, estimates what a business is worth today by projecting the cash it can generate in the future and then discounting those cash flows back to the present.
For Broadcom, the model starts with last twelve months free cash flow of about $24.8 billion, already a very large base. Analysts provide detailed forecasts for several years, and Simply Wall St then extrapolates beyond those figures. The projected free cash flow rises to roughly $163.1 billion in 2035. That implies very strong compounding from an already high level, which helps explain why the DCF produces such a high absolute valuation.
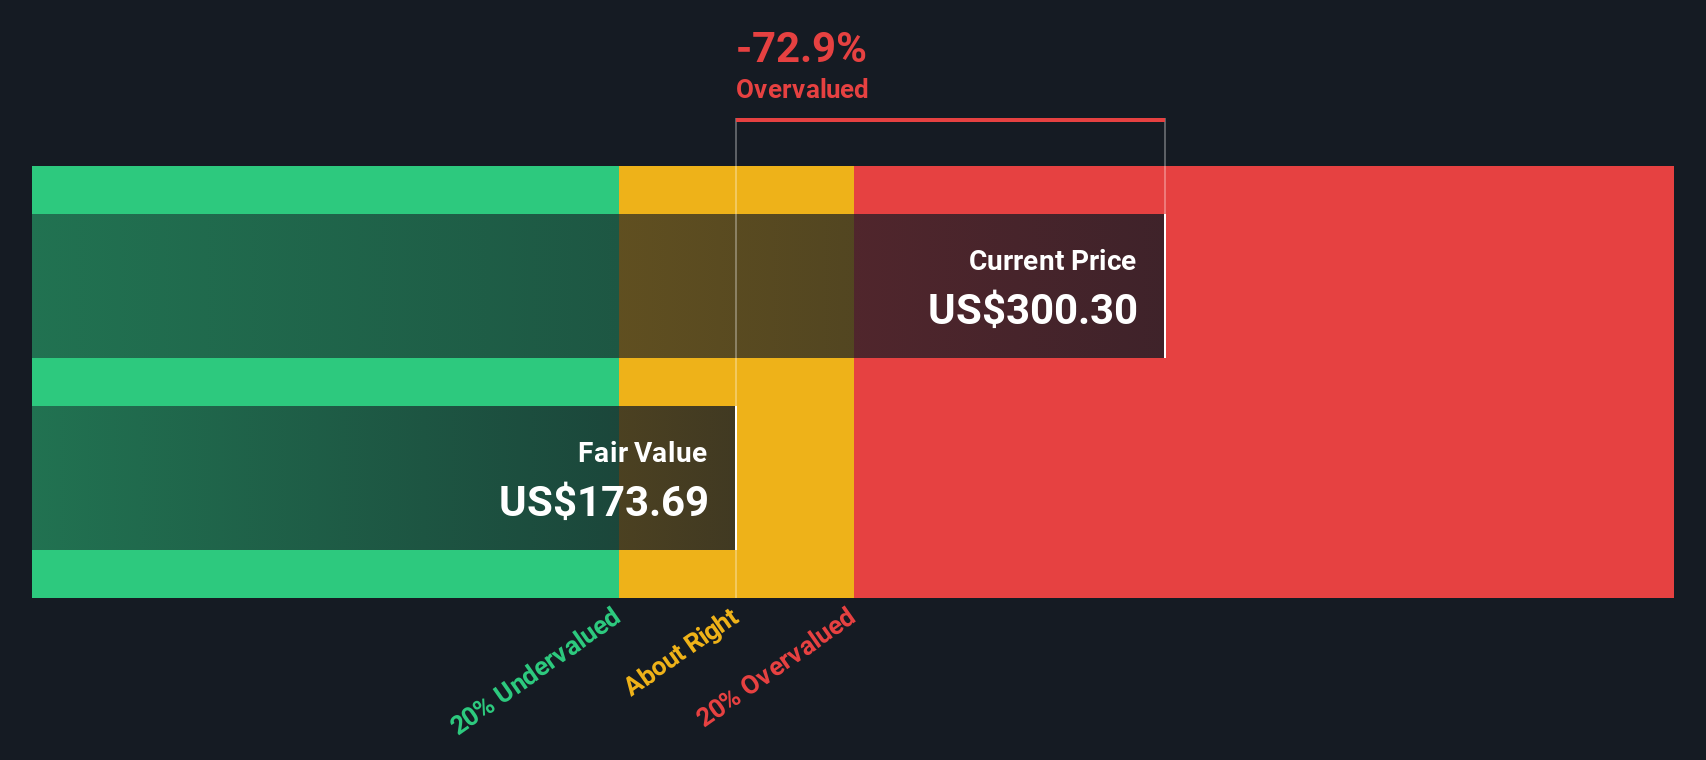
After discounting all those future cash flows using a 2 Stage Free Cash Flow to Equity model, the estimated intrinsic value comes out at about $303.92 per share. Compared with the current share price, this implies the stock is roughly 28.4% overvalued on a pure cash flow basis.
Result: OVERVALUED
Our Discounted Cash Flow (DCF) analysis suggests Broadcom may be overvalued by 28.4%. Discover 908 undervalued stocks or create your own screener to find better value opportunities.
Approach 2: Broadcom Price vs Earnings
For consistently profitable companies like Broadcom, the price to earnings ratio is often the most intuitive way to gauge valuation, because it links what investors pay directly to the profits the business is generating today.
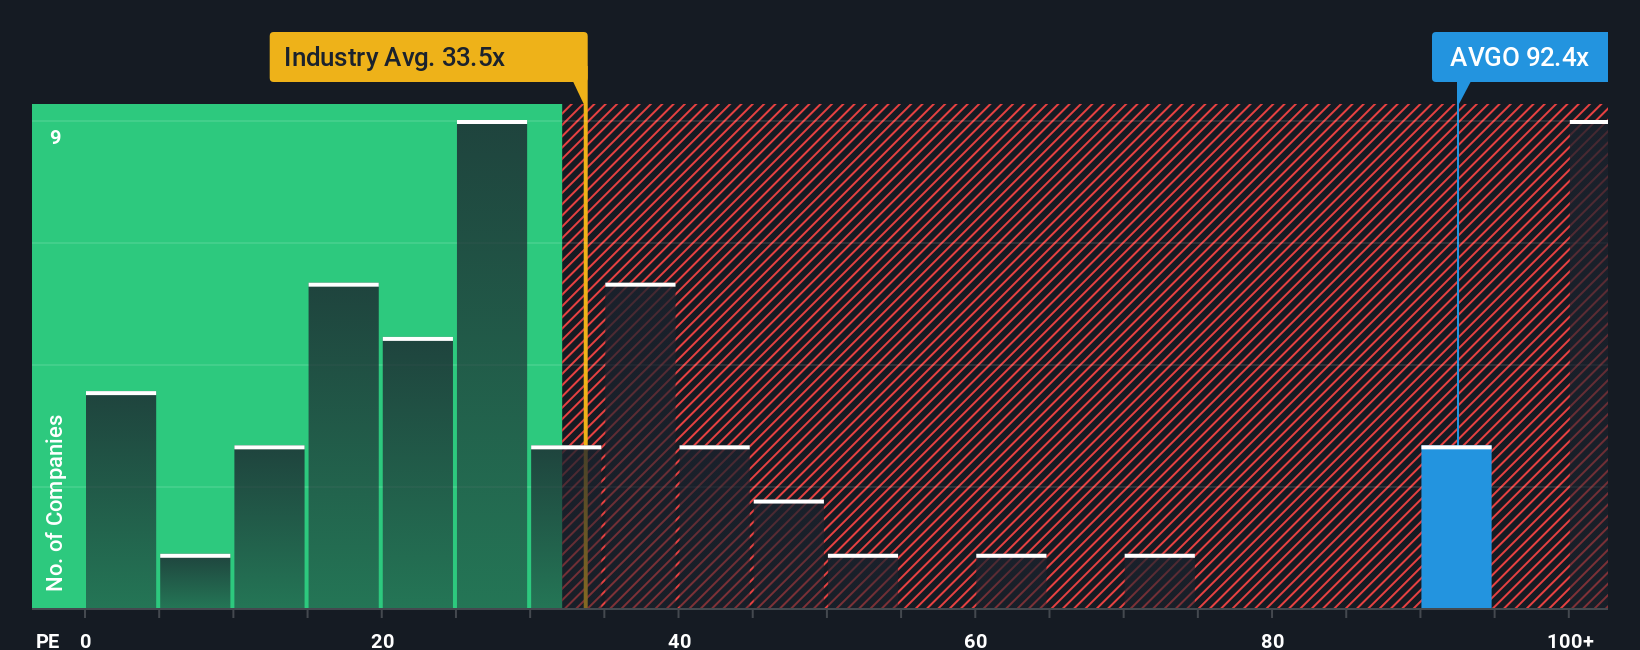
In general, higher growth and lower perceived risk justify a higher normal or fair PE ratio. Slower growth or higher uncertainty call for a lower one. Broadcom currently trades on a PE of about 98x, which is far above the broader Semiconductor industry average of roughly 38x and also well ahead of its peer group average around 56x. On those simple comparisons, the stock looks expensive.
Simply Wall St’s Fair Ratio seeks to improve on those blunt yardsticks by estimating the PE you might reasonably expect given Broadcom’s specific earnings growth outlook, profitability, industry, size and risk profile. For Broadcom, that Fair Ratio is about 66.1x, materially below the current 98x multiple. Because this framework bakes in company specific drivers rather than just comparing to broad averages, it can give a more nuanced view of what “expensive” really means.
Result: OVERVALUED
PE ratios tell one story, but what if the real opportunity lies elsewhere? Discover 1452 companies where insiders are betting big on explosive growth.
Upgrade Your Decision Making: Choose your Broadcom Narrative
Earlier we mentioned that there is an even better way to understand valuation. Let us introduce you to Narratives, a simple framework that lets you turn your view of Broadcom into a story backed by numbers. You can spell out what you think will happen to its revenue, earnings and margins, link that story to a forecast on Simply Wall St’s Community page, and automatically see the Fair Value that follows. This allows you to compare it to today’s share price, monitor when that gap suggests it may be time to buy or sell, and watch your Narrative update dynamically as new news or earnings arrive.
One Broadcom investor might build a bullish Narrative around accelerating AI chip demand, VMware integration and a Fair Value closer to the higher end of recent analyst targets. Another, more cautious investor might focus on customer concentration, competition and debt, and therefore set assumptions that lead to a much lower Fair Value closer to the most bearish target, even though both are using the same tool.
Do you think there's more to the story for Broadcom? Head over to our Community to see what others are saying!
This article by Simply Wall St is general in nature. We provide commentary based on historical data and analyst forecasts only using an unbiased methodology and our articles are not intended to be financial advice. It does not constitute a recommendation to buy or sell any stock, and does not take account of your objectives, or your financial situation. We aim to bring you long-term focused analysis driven by fundamental data. Note that our analysis may not factor in the latest price-sensitive company announcements or qualitative material. Simply Wall St has no position in any stocks mentioned.
Have feedback on this article? Concerned about the content? Get in touch with us directly. Alternatively, email editorial-team@simplywallst.com