
Is AOM International Group (HKG:381) Using Too Much Debt?
David Iben put it well when he said, 'Volatility is not a risk we care about. What we care about is avoiding the permanent loss of capital.' So it seems the smart money knows that debt - which is usually involved in bankruptcies - is a very important factor, when you assess how risky a company is. We note that AOM International Group Company Limited (HKG:381) does have debt on its balance sheet. But should shareholders be worried about its use of debt?
When Is Debt Dangerous?
Debt is a tool to help businesses grow, but if a business is incapable of paying off its lenders, then it exists at their mercy. If things get really bad, the lenders can take control of the business. However, a more common (but still painful) scenario is that it has to raise new equity capital at a low price, thus permanently diluting shareholders. Having said that, the most common situation is where a company manages its debt reasonably well - and to its own advantage. When we examine debt levels, we first consider both cash and debt levels, together.
What Is AOM International Group's Net Debt?
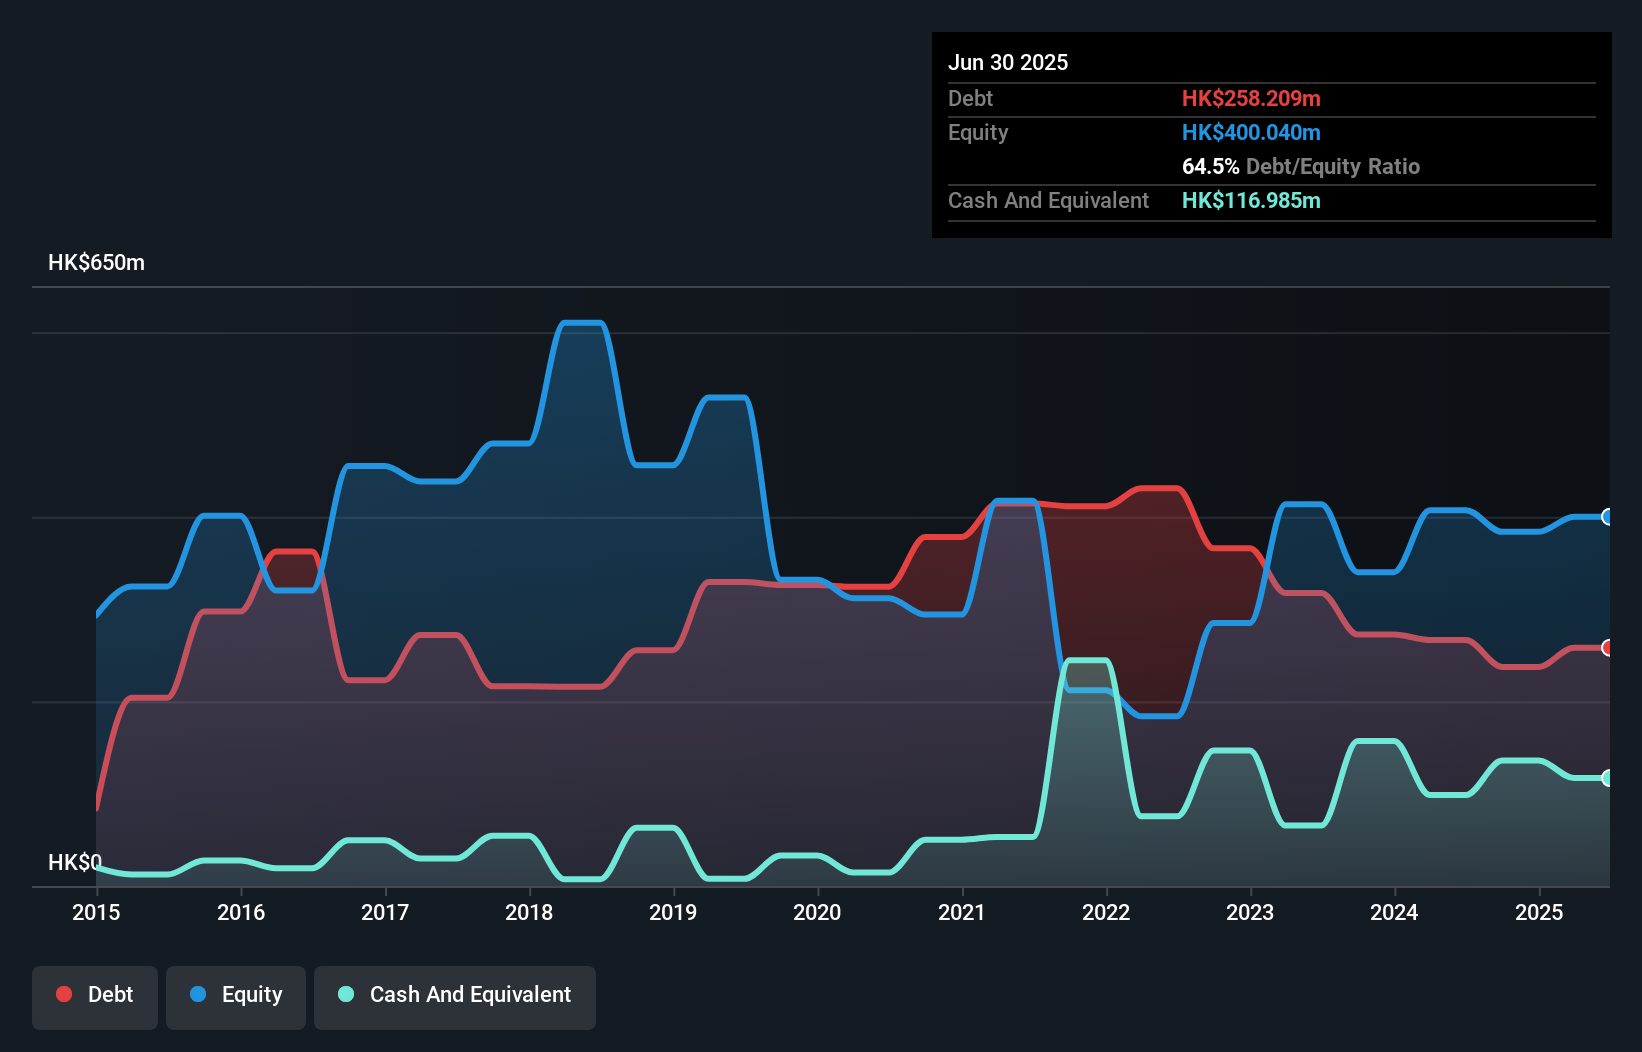
As you can see below, AOM International Group had HK$258.2m of debt, at June 2025, which is about the same as the year before. You can click the chart for greater detail. On the flip side, it has HK$117.0m in cash leading to net debt of about HK$141.2m.
How Healthy Is AOM International Group's Balance Sheet?
The latest balance sheet data shows that AOM International Group had liabilities of HK$430.7m due within a year, and liabilities of HK$13.1m falling due after that. On the other hand, it had cash of HK$117.0m and HK$67.6m worth of receivables due within a year. So it has liabilities totalling HK$259.2m more than its cash and near-term receivables, combined.
When you consider that this deficiency exceeds the company's HK$229.2m market capitalization, you might well be inclined to review the balance sheet intently. In the scenario where the company had to clean up its balance sheet quickly, it seems likely shareholders would suffer extensive dilution.
View our latest analysis for AOM International Group
In order to size up a company's debt relative to its earnings, we calculate its net debt divided by its earnings before interest, tax, depreciation, and amortization (EBITDA) and its earnings before interest and tax (EBIT) divided by its interest expense (its interest cover). Thus we consider debt relative to earnings both with and without depreciation and amortization expenses.
Weak interest cover of 0.35 times and a disturbingly high net debt to EBITDA ratio of 7.2 hit our confidence in AOM International Group like a one-two punch to the gut. The debt burden here is substantial. Even worse, AOM International Group saw its EBIT tank 38% over the last 12 months. If earnings keep going like that over the long term, it has a snowball's chance in hell of paying off that debt. There's no doubt that we learn most about debt from the balance sheet. But it is AOM International Group's earnings that will influence how the balance sheet holds up in the future. So when considering debt, it's definitely worth looking at the earnings trend. Click here for an interactive snapshot.
Finally, while the tax-man may adore accounting profits, lenders only accept cold hard cash. So we always check how much of that EBIT is translated into free cash flow. During the last three years, AOM International Group burned a lot of cash. While that may be a result of expenditure for growth, it does make the debt far more risky.
Our View
On the face of it, AOM International Group's conversion of EBIT to free cash flow left us tentative about the stock, and its EBIT growth rate was no more enticing than the one empty restaurant on the busiest night of the year. And furthermore, its net debt to EBITDA also fails to instill confidence. Considering all the factors previously mentioned, we think that AOM International Group really is carrying too much debt. To our minds, that means the stock is rather high risk, and probably one to avoid; but to each their own (investing) style. When analysing debt levels, the balance sheet is the obvious place to start. However, not all investment risk resides within the balance sheet - far from it. For example AOM International Group has 3 warning signs (and 1 which doesn't sit too well with us) we think you should know about.
If, after all that, you're more interested in a fast growing company with a rock-solid balance sheet, then check out our list of net cash growth stocks without delay.
Have feedback on this article? Concerned about the content? Get in touch with us directly. Alternatively, email editorial-team (at) simplywallst.com.
This article by Simply Wall St is general in nature. We provide commentary based on historical data and analyst forecasts only using an unbiased methodology and our articles are not intended to be financial advice. It does not constitute a recommendation to buy or sell any stock, and does not take account of your objectives, or your financial situation. We aim to bring you long-term focused analysis driven by fundamental data. Note that our analysis may not factor in the latest price-sensitive company announcements or qualitative material. Simply Wall St has no position in any stocks mentioned.