
A Look Ahead: Sterling Infrastructure's Earnings Forecast
Sterling Infrastructure (NASDAQ:STRL) is set to give its latest quarterly earnings report on Monday, 2025-08-04. Here's what investors need to know before the announcement.
Analysts estimate that Sterling Infrastructure will report an earnings per share (EPS) of $2.20.
Sterling Infrastructure bulls will hope to hear the company announce they've not only beaten that estimate, but also to provide positive guidance, or forecasted growth, for the next quarter.
New investors should note that it is sometimes not an earnings beat or miss that most affects the price of a stock, but the guidance (or forecast).
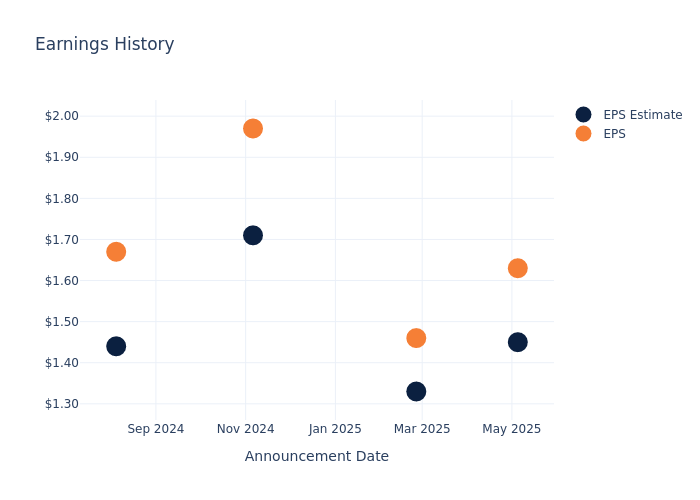
Earnings History Snapshot
Last quarter the company beat EPS by $0.18, which was followed by a 3.17% increase in the share price the next day.
Here's a look at Sterling Infrastructure's past performance and the resulting price change:
| Quarter | Q1 2025 | Q4 2024 | Q3 2024 | Q2 2024 |
|---|---|---|---|---|
| EPS Estimate | 1.45 | 1.33 | 1.71 | 1.44 |
| EPS Actual | 1.63 | 1.46 | 1.97 | 1.67 |
| Price Change % | 3.0% | 5.0% | -1.0% | 4.0% |
Market Performance of Sterling Infrastructure's Stock
Shares of Sterling Infrastructure were trading at $267.59 as of July 31. Over the last 52-week period, shares are up 157.45%. Given that these returns are generally positive, long-term shareholders are likely bullish going into this earnings release.
Insights Shared by Analysts on Sterling Infrastructure
For investors, staying informed about market sentiments and expectations in the industry is paramount. This analysis provides an exploration of the latest insights on Sterling Infrastructure.
Analysts have given Sterling Infrastructure a total of 1 ratings, with the consensus rating being Buy. The average one-year price target is $265.0, indicating a potential 0.97% downside.
Peer Ratings Comparison
The below comparison of the analyst ratings and average 1-year price targets of Dycom Industries, Valmont Industries and Fluor, three prominent players in the industry, gives insights for their relative performance expectations and market positioning.
- Analysts currently favor an Buy trajectory for Dycom Industries, with an average 1-year price target of $260.11, suggesting a potential 2.8% downside.
- Analysts currently favor an Buy trajectory for Valmont Industries, with an average 1-year price target of $391.0, suggesting a potential 46.12% upside.
- Analysts currently favor an Buy trajectory for Fluor, with an average 1-year price target of $54.43, suggesting a potential 79.66% downside.
Peer Analysis Summary
The peer analysis summary outlines pivotal metrics for Dycom Industries, Valmont Industries and Fluor, demonstrating their respective standings within the industry and offering valuable insights into their market positions and comparative performance.
| Company | Consensus | Revenue Growth | Gross Profit | Return on Equity |
|---|---|---|---|---|
| Sterling Infrastructure | Buy | -2.14% | $94.84M | 4.89% |
| Dycom Industries | Buy | 10.17% | $247.50M | 4.87% |
| Valmont Industries | Buy | 8.38% | $291.10M | -0.25% |
| Fluor | Buy | 6.64% | $140M | -6.39% |
Key Takeaway:
Sterling Infrastructure ranks at the bottom for Revenue Growth among its peers. It is in the middle for Gross Profit. The company is at the top for Return on Equity.
All You Need to Know About Sterling Infrastructure
Sterling Infrastructure Inc is a construction company that specializes in heavy civil infrastructure construction and infrastructure rehabilitation as well as residential construction projects. The company operates in three reportable segments namely, Transportation Solutions, E-Infrastructure Solutions, and Building Solution. Transportation Solutions include highways, roads, bridges, airfields, ports, light rail, and others. Building Solution projects include concrete foundations for single-family homes. E-Infrastructure Solutions include the services which are provided to large, blue-chip companies in the e-commerce, data center, distribution center, and warehousing, energy, mixed-use, and multi-family sectors. The majority of the revenue is generated from E-Infrastructure Solutions.
Sterling Infrastructure's Economic Impact: An Analysis
Market Capitalization: With restricted market capitalization, the company is positioned below industry averages. This reflects a smaller scale relative to peers.
Revenue Growth: Sterling Infrastructure's revenue growth over a period of 3 months has faced challenges. As of 31 March, 2025, the company experienced a revenue decline of approximately -2.14%. This indicates a decrease in the company's top-line earnings. In comparison to its industry peers, the company trails behind with a growth rate lower than the average among peers in the Industrials sector.
Net Margin: Sterling Infrastructure's net margin excels beyond industry benchmarks, reaching 9.16%. This signifies efficient cost management and strong financial health.
Return on Equity (ROE): Sterling Infrastructure's financial strength is reflected in its exceptional ROE, which exceeds industry averages. With a remarkable ROE of 4.89%, the company showcases efficient use of equity capital and strong financial health.
Return on Assets (ROA): Sterling Infrastructure's ROA surpasses industry standards, highlighting the company's exceptional financial performance. With an impressive 1.95% ROA, the company effectively utilizes its assets for optimal returns.
Debt Management: The company maintains a balanced debt approach with a debt-to-equity ratio below industry norms, standing at 0.45.
This article was generated by Benzinga's automated content engine and reviewed by an editor.