
Does Philips Share Price Reflect Its Recovery After Product Safety Settlements?
- If you are wondering whether Koninklijke Philips is a bargain or a value trap at around €22.72, this article will walk you through what the numbers actually say, without the noise.
- The stock has pulled back recently, down 6.2% over the last week, 7.4% over the past month, and 7.2% year to date, but it is still up 92.9% over three years despite being 37.7% lower than five years ago.
- These moves follow a series of developments around product safety settlements and ongoing restructuring, which have helped reset expectations about both risk and long term profitability. At the same time, investors are watching management's execution on cost savings and portfolio focus, which are key drivers behind the market's shifting view of Philips.
- On our framework Philips only scores 2 out of 6 on undervaluation checks. In the next sections we will break down what different valuation methods are indicating today, and then finish with a more robust way to think about what this price really implies.
Koninklijke Philips scores just 2/6 on our valuation checks. See what other red flags we found in the full valuation breakdown.
Approach 1: Koninklijke Philips Discounted Cash Flow (DCF) Analysis
A Discounted Cash Flow model estimates what a business is worth by projecting the cash it can generate in the future and discounting those cash flows back to today's value using a required return.
For Koninklijke Philips, the latest twelve month Free Cash Flow is about €574.3 Million. Analysts and extrapolated estimates from Simply Wall St see this rising to roughly €1.81 Billion by 2029, with further gradual growth implied in the following years. These projections are fed into a 2 Stage Free Cash Flow to Equity model, which applies a higher growth phase followed by a more mature phase as cash flows stabilize.
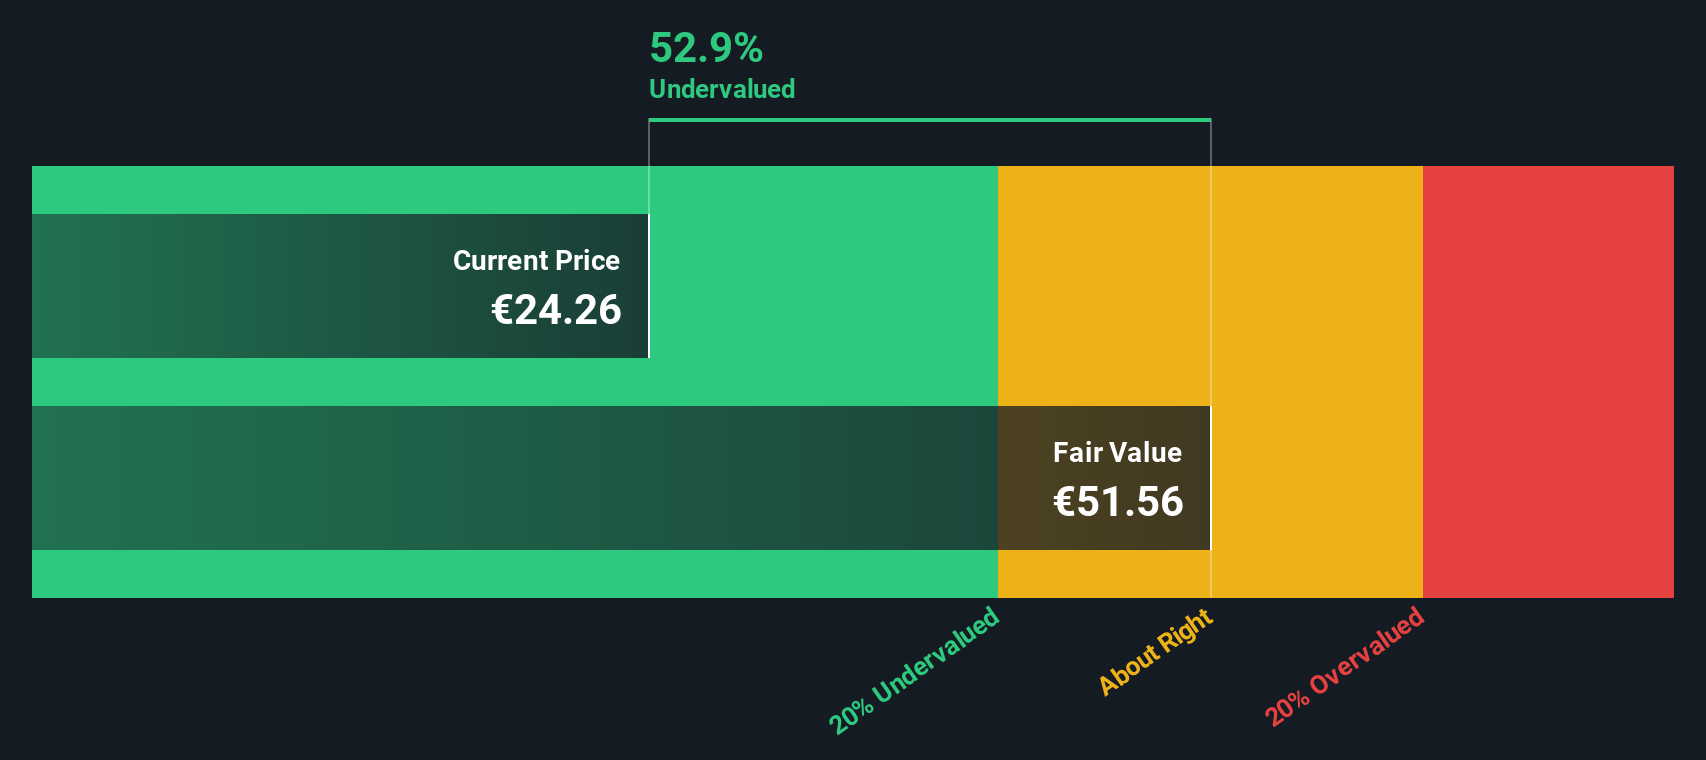
On this basis, the DCF model arrives at an intrinsic value of about €37.14 per share. Compared to the recent share price around €22.72, this indicates the stock trades at roughly a 38.8% discount to its estimated fair value, assuming the cash flow trajectory occurs in line with the model's inputs.
Result: UNDERVALUED
Our Discounted Cash Flow (DCF) analysis suggests Koninklijke Philips is undervalued by 38.8%. Track this in your watchlist or portfolio, or discover 914 more undervalued stocks based on cash flows.
Approach 2: Koninklijke Philips Price vs Earnings
For profitable companies, the price to earnings ratio is often the most intuitive way to think about valuation, because it links the share price directly to the profits each share is entitled to. Investors are essentially asking how many years of current earnings they are willing to pay for today.
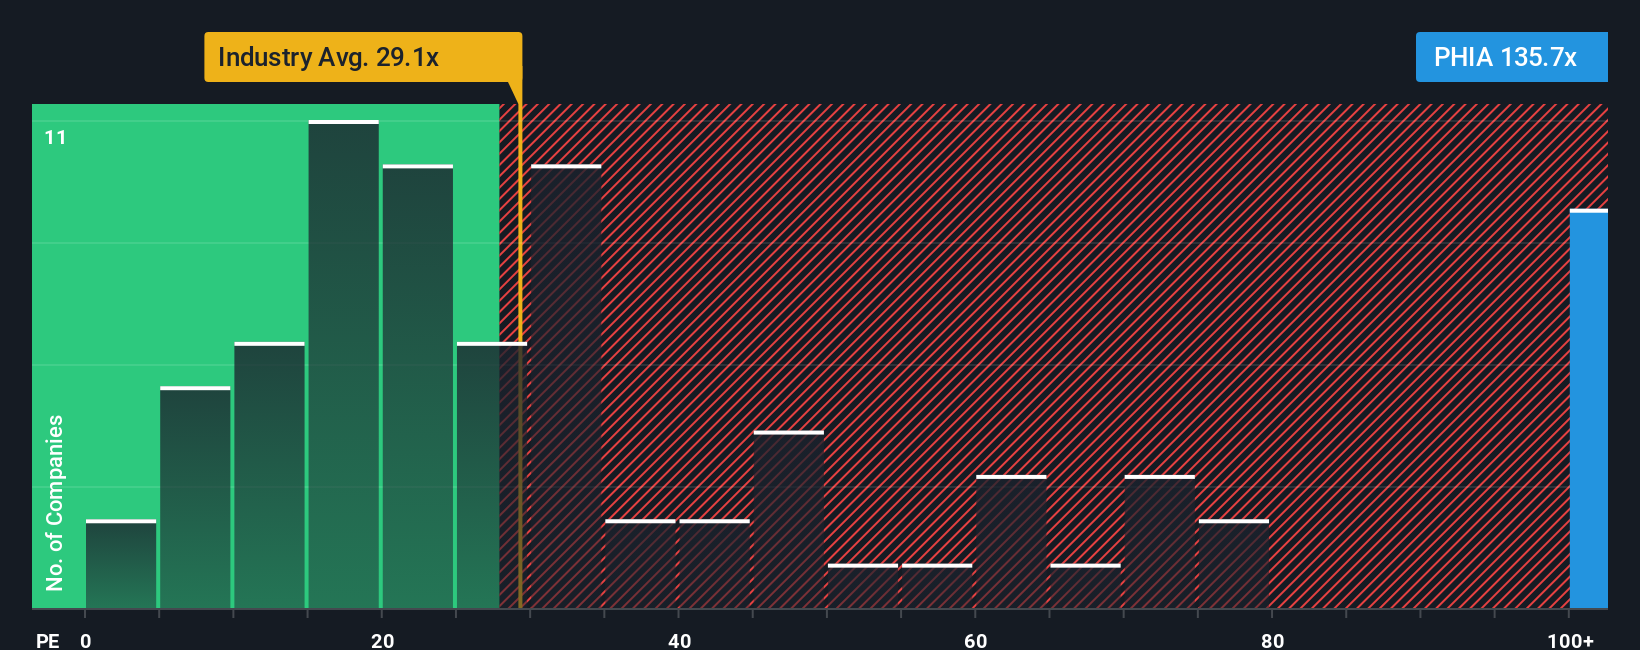
What counts as a normal or fair PE ratio depends heavily on how quickly earnings are expected to grow and how risky those earnings are. Faster, more predictable growth usually justifies a higher PE, while slower or more volatile earnings should trade on a lower multiple. Against this backdrop, Philips currently trades on about 124.9x earnings, versus roughly 27.7x for the wider Medical Equipment industry and around 27.4x for close peers, suggesting a very rich headline valuation.
Simply Wall St also uses a proprietary Fair Ratio, which estimates what PE multiple would be reasonable for Philips given its specific earnings growth outlook, profit margins, risk profile, industry and market cap. This can be more informative than a simple peer or sector comparison, which ignores these company specific nuances. On this framework, Philips trades well above its Fair Ratio, indicating that, relative to its fundamentals, the market is paying too much for its current earnings power.
Result: OVERVALUED
PE ratios tell one story, but what if the real opportunity lies elsewhere? Discover 1442 companies where insiders are betting big on explosive growth.
Upgrade Your Decision Making: Choose your Koninklijke Philips Narrative
Earlier we mentioned that there is an even better way to understand valuation, so let us introduce you to Narratives, a simple way to connect the story you believe about a company with the numbers behind its value. A Narrative is your own clearly stated view of Philips future, where you spell out assumptions for revenue growth, profit margins and risk, then see how those assumptions flow through to a financial forecast and ultimately to a fair value estimate per share. Narratives are available on Simply Wall St's Community page, where millions of investors use them as an easy tool to compare their Fair Value to the current Price and decide whether it is time to buy, hold, or sell. Because Narratives are updated dynamically as fresh news, guidance or earnings arrive, your view of Philips can adapt in real time rather than staying stuck on outdated data. For example, one Philips Narrative might assume strong recovery and assign a much higher fair value than another Narrative that bakes in slower growth and lingering legal risks.
Do you think there's more to the story for Koninklijke Philips? Head over to our Community to see what others are saying!
This article by Simply Wall St is general in nature. We provide commentary based on historical data and analyst forecasts only using an unbiased methodology and our articles are not intended to be financial advice. It does not constitute a recommendation to buy or sell any stock, and does not take account of your objectives, or your financial situation. We aim to bring you long-term focused analysis driven by fundamental data. Note that our analysis may not factor in the latest price-sensitive company announcements or qualitative material. Simply Wall St has no position in any stocks mentioned.
Have feedback on this article? Concerned about the content? Get in touch with us directly. Alternatively, email editorial-team@simplywallst.com