
Does Pfizer’s Post Pandemic Strategy Make Sense at Today’s Price?
- Wondering if Pfizer is quietly turning into a value opportunity while everyone has moved on to the next hot stock? Let us unpack whether the current price really reflects its long term prospects.
- After a rough few years, Pfizer's share price has clawed back about 5.8% over the last month and is up 7.2% over the past year, even though it is still down sharply over three years.
- Recent headlines have focused on Pfizer reshaping its post pandemic portfolio, from advancing its mRNA and oncology pipelines to pushing forward with new vaccines and therapeutics, which has helped reset expectations around its long term earnings power. At the same time, investor attention has been shifting toward how its acquisitions and cost cutting plans could support a leaner, more focused business.
- Right now, Pfizer scores a solid 5/6 on our valuation checks, suggesting the market may still be underestimating its underlying value, but traditional ratios only tell part of the story. Next we will walk through the main valuation approaches investors use for Pfizer and finish with a more comprehensive way to think about what the stock is really worth.
Find out why Pfizer's 7.2% return over the last year is lagging behind its peers.
Approach 1: Pfizer Discounted Cash Flow (DCF) Analysis
A Discounted Cash Flow model estimates what a company is worth by projecting the cash it can generate in the future and discounting those cash flows back to today in $ terms.
For Pfizer, the latest twelve month Free Cash Flow is about $9.9 billion. Analysts and extrapolated estimates from Simply Wall St see Free Cash Flow rising to roughly $19.5 billion by 2026 and remaining around the mid $15 to $16 billion range by 2035. This suggests a solid, but not explosive, long term cash generation profile. These projections are fed into a 2 Stage Free Cash Flow to Equity model, which blends a higher growth phase with a more mature, steady state phase.
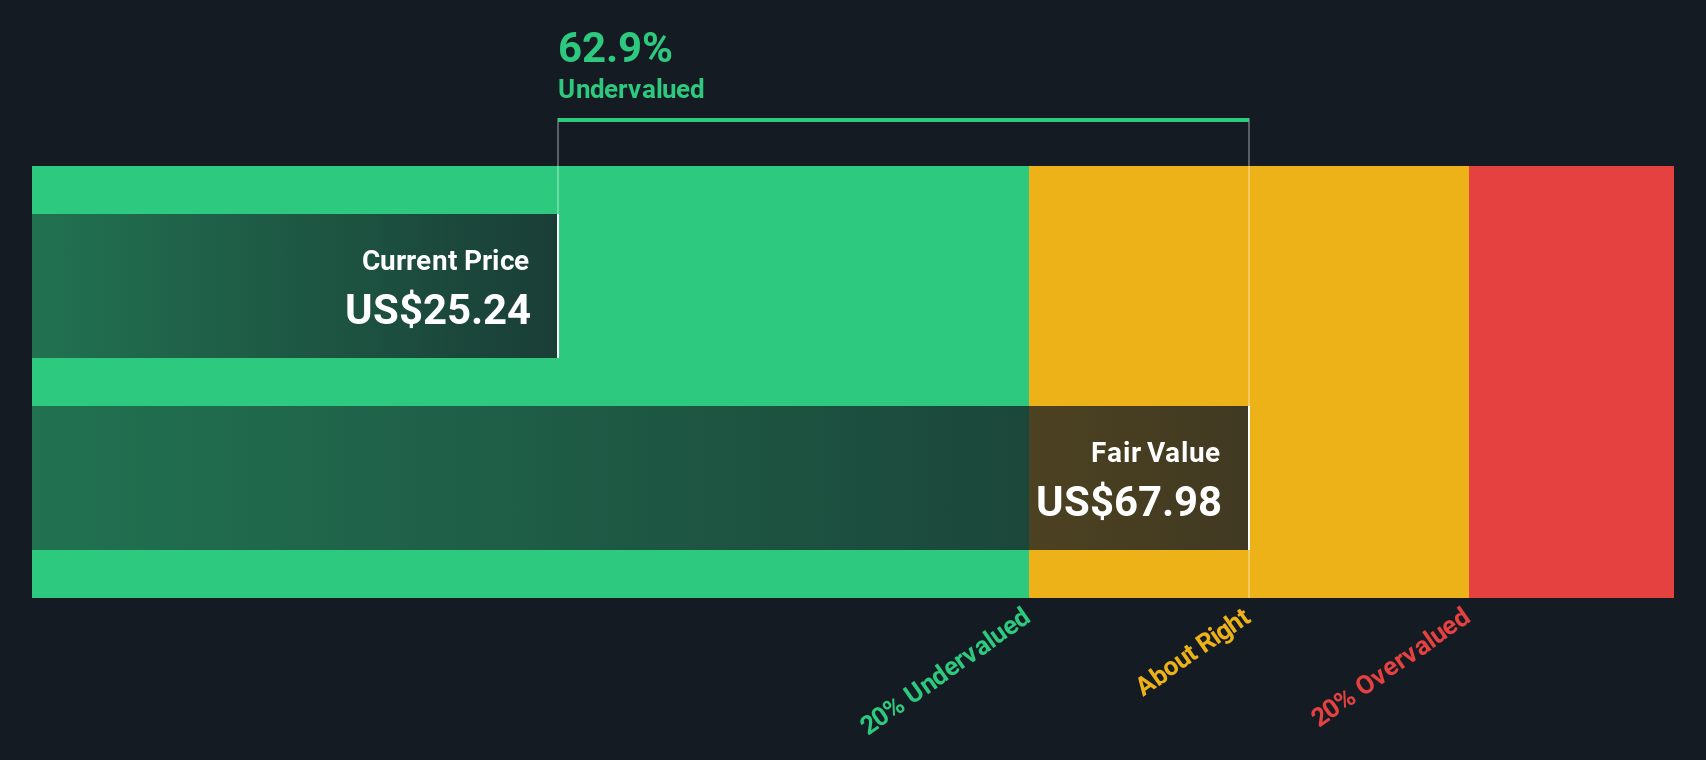
On this basis, Pfizer’s estimated intrinsic value comes out at about $62.11 per share. Compared with the current share price, this implies the stock is roughly 58.6% undervalued according to the DCF model.
Result: UNDERVALUED
Our Discounted Cash Flow (DCF) analysis suggests Pfizer is undervalued by 58.6%. Track this in your watchlist or portfolio, or discover 912 more undervalued stocks based on cash flows.
Approach 2: Pfizer Price vs Earnings
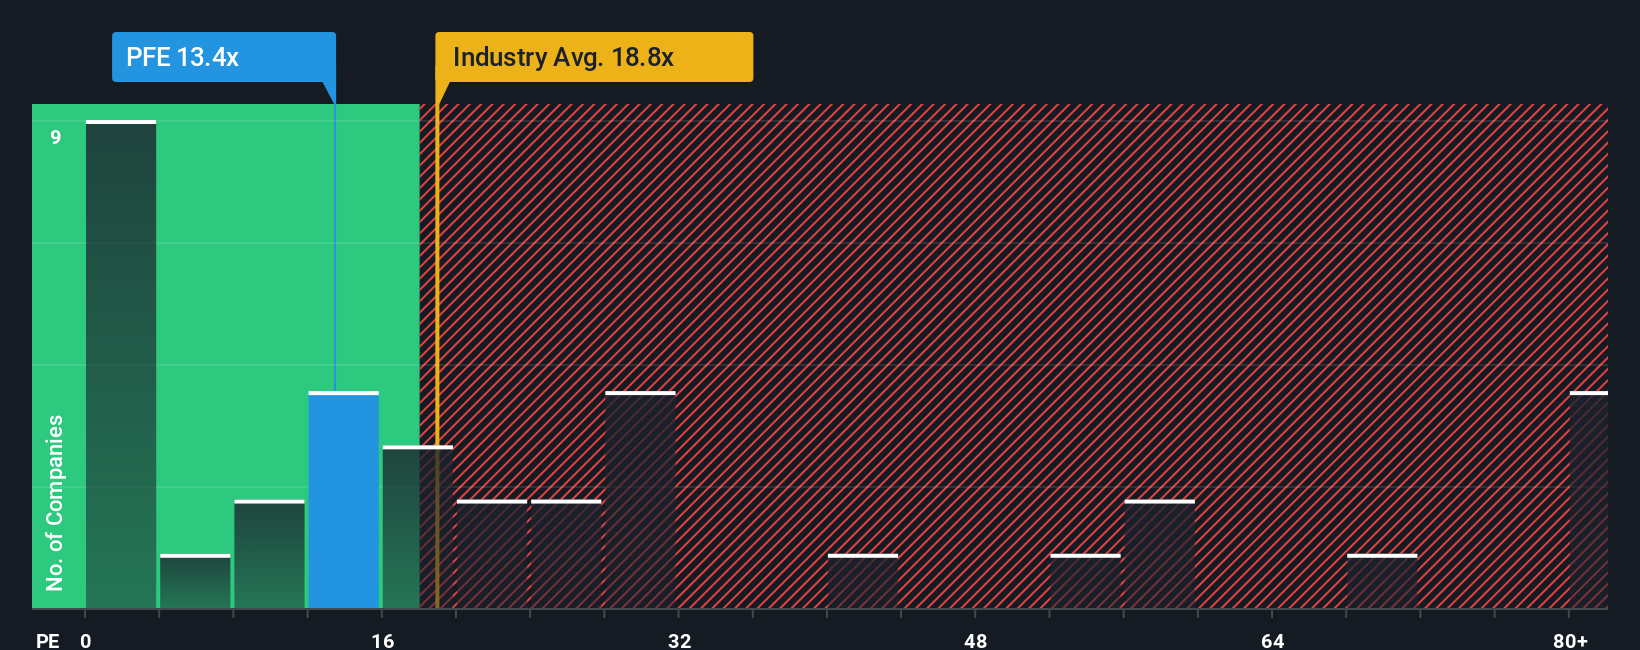
For a mature, profitable business like Pfizer, the price to earnings ratio is a useful way to gauge how much investors are willing to pay today for each dollar of current earnings. In general, companies with stronger and more reliable growth, or lower perceived risk, tend to justify a higher PE multiple, while slower growing or riskier businesses tend to trade on lower PE ratios.
Pfizer currently trades on about 14.9x earnings, which is below both the broader Pharmaceuticals industry average of roughly 19.7x and the peer group average of around 17.5x. Simply Wall St also calculates a proprietary Fair Ratio of 26.2x for Pfizer. This Fair Ratio represents the PE multiple the stock might reasonably command when you factor in its specific earnings growth outlook, profitability, industry positioning, market capitalization and risk profile.
Unlike a simple comparison to peers or the sector, the Fair Ratio aims to put Pfizer’s valuation into context by adjusting for what actually drives its earnings power over time. With Pfizer trading at 14.9x versus a Fair Ratio of 26.2x, the shares appear meaningfully undervalued on this earnings-based lens.
Result: UNDERVALUED
PE ratios tell one story, but what if the real opportunity lies elsewhere? Discover 1442 companies where insiders are betting big on explosive growth.
Upgrade Your Decision Making: Choose your Pfizer Narrative
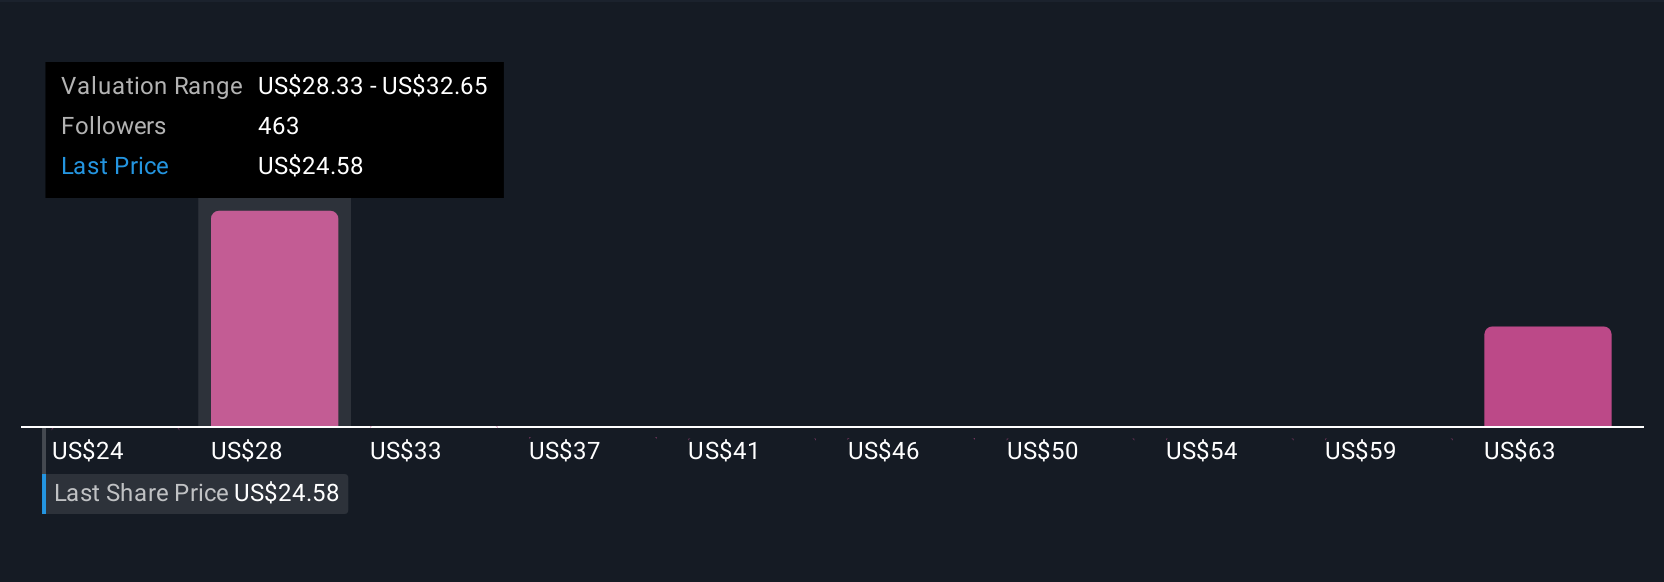
Earlier we mentioned that there is an even better way to understand valuation, so let us introduce you to Narratives, which are simple stories you create about a company that tie your view of its future revenue, earnings and margins to a specific fair value estimate. Instead of just staring at ratios, a Narrative connects three things: the business story you believe, the financial forecast that flows from that story, and the fair value per share that falls out of those numbers. On Simply Wall St’s Community page, millions of investors use Narratives as an easy, accessible tool to decide when to buy or sell by comparing their Narrative Fair Value to the current market price. Those Narratives update dynamically as new news, earnings or guidance come in. For Pfizer, one investor might build a Narrative that assumes oncology growth and new launches lift margins enough to justify a fair value near the bullish end of current estimates around $35.77 per share, while another might focus on pricing pressure and patent cliffs and conclude the stock is only worth something closer to $24.00 per share, with both perspectives made explicit and testable against the live price.
For Pfizer however we will make it really easy for you with previews of two leading Pfizer Narratives:
Fair value: $29.08 per share
Implied undervaluation vs last close: -11.6%
Revenue growth assumption: -2.66%
- Expects late stage oncology, rare disease and vaccine launches, including obesity assets, to offset the patent cliff and support durable earnings growth.
- Sees digitalization, AI powered R&D and cost efficiencies, plus emerging market expansion, lifting margins and broadening the revenue base.
- Anchors on an analyst consensus fair value modestly above today’s price, with upside driven by successful execution of acquisitions and the innovation pipeline.
Fair value: $24.00 per share
Implied overvaluation vs last close: 7.1%
Revenue growth assumption: -4.21%
- Assumes drug price negotiations, regulatory reforms and patent expiries on key products drive a sustained revenue decline despite new launches.
- Views the pipeline and deal activity as carrying execution risk, with new assets unlikely to fully replace lost blockbuster sales in time.
- Concludes that, on more cautious earnings and multiple assumptions, Pfizer is priced close to or slightly above what the bearish scenario would justify.
Do you think there's more to the story for Pfizer? Head over to our Community to see what others are saying!
This article by Simply Wall St is general in nature. We provide commentary based on historical data and analyst forecasts only using an unbiased methodology and our articles are not intended to be financial advice. It does not constitute a recommendation to buy or sell any stock, and does not take account of your objectives, or your financial situation. We aim to bring you long-term focused analysis driven by fundamental data. Note that our analysis may not factor in the latest price-sensitive company announcements or qualitative material. Simply Wall St has no position in any stocks mentioned.
Have feedback on this article? Concerned about the content? Get in touch with us directly. Alternatively, email editorial-team@simplywallst.com