
Individual investors are Viva Goods Company Limited's (HKG:933) biggest owners and were hit after market cap dropped HK$498m
Key Insights
- Viva Goods' significant individual investors ownership suggests that the key decisions are influenced by shareholders from the larger public
- A total of 4 investors have a majority stake in the company with 51% ownership
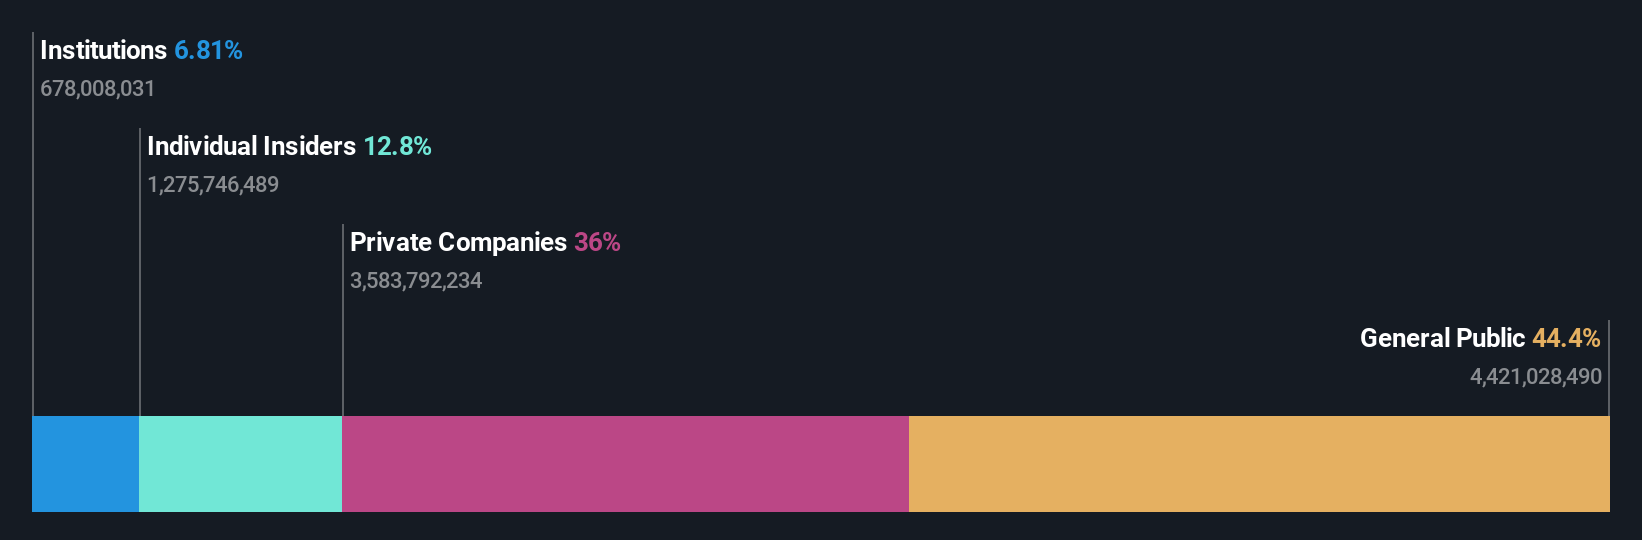
- Insiders own 13% of Viva Goods
Every investor in Viva Goods Company Limited (HKG:933) should be aware of the most powerful shareholder groups. And the group that holds the biggest piece of the pie are individual investors with 44% ownership. In other words, the group stands to gain the most (or lose the most) from their investment into the company.
And following last week's 7.6% decline in share price, individual investors suffered the most losses.
Let's take a closer look to see what the different types of shareholders can tell us about Viva Goods.
Check out our latest analysis for Viva Goods
What Does The Institutional Ownership Tell Us About Viva Goods?
Institutions typically measure themselves against a benchmark when reporting to their own investors, so they often become more enthusiastic about a stock once it's included in a major index. We would expect most companies to have some institutions on the register, especially if they are growing.
We can see that Viva Goods does have institutional investors; and they hold a good portion of the company's stock. This suggests some credibility amongst professional investors. But we can't rely on that fact alone since institutions make bad investments sometimes, just like everyone does. When multiple institutions own a stock, there's always a risk that they are in a 'crowded trade'. When such a trade goes wrong, multiple parties may compete to sell stock fast. This risk is higher in a company without a history of growth. You can see Viva Goods' historic earnings and revenue below, but keep in mind there's always more to the story.

Viva Goods is not owned by hedge funds. Lead Ahead Limited is currently the company's largest shareholder with 21% of shares outstanding. In comparison, the second and third largest shareholders hold about 14% and 9.2% of the stock. Furthermore, CEO Ning Li is the owner of 3.1% of the company's shares.
Our research also brought to light the fact that roughly 51% of the company is controlled by the top 4 shareholders suggesting that these owners wield significant influence on the business.
While studying institutional ownership for a company can add value to your research, it is also a good practice to research analyst recommendations to get a deeper understand of a stock's expected performance. We're not picking up on any analyst coverage of the stock at the moment, so the company is unlikely to be widely held.
Insider Ownership Of Viva Goods
While the precise definition of an insider can be subjective, almost everyone considers board members to be insiders. The company management answer to the board and the latter should represent the interests of shareholders. Notably, sometimes top-level managers are on the board themselves.
Most consider insider ownership a positive because it can indicate the board is well aligned with other shareholders. However, on some occasions too much power is concentrated within this group.
Our most recent data indicates that insiders own a reasonable proportion of Viva Goods Company Limited. It has a market capitalization of just HK$6.1b, and insiders have HK$778m worth of shares in their own names. It is great to see insiders so invested in the business. It might be worth checking if those insiders have been buying recently.
General Public Ownership
The general public-- including retail investors -- own 44% stake in the company, and hence can't easily be ignored. While this group can't necessarily call the shots, it can certainly have a real influence on how the company is run.
Private Company Ownership
Our data indicates that Private Companies hold 36%, of the company's shares. It's hard to draw any conclusions from this fact alone, so its worth looking into who owns those private companies. Sometimes insiders or other related parties have an interest in shares in a public company through a separate private company.
Next Steps:
I find it very interesting to look at who exactly owns a company. But to truly gain insight, we need to consider other information, too. Consider for instance, the ever-present spectre of investment risk. We've identified 1 warning sign with Viva Goods , and understanding them should be part of your investment process.
Of course, you might find a fantastic investment by looking elsewhere. So take a peek at this free list of interesting companies.
NB: Figures in this article are calculated using data from the last twelve months, which refer to the 12-month period ending on the last date of the month the financial statement is dated. This may not be consistent with full year annual report figures.
Have feedback on this article? Concerned about the content? Get in touch with us directly. Alternatively, email editorial-team (at) simplywallst.com.
This article by Simply Wall St is general in nature. We provide commentary based on historical data and analyst forecasts only using an unbiased methodology and our articles are not intended to be financial advice. It does not constitute a recommendation to buy or sell any stock, and does not take account of your objectives, or your financial situation. We aim to bring you long-term focused analysis driven by fundamental data. Note that our analysis may not factor in the latest price-sensitive company announcements or qualitative material. Simply Wall St has no position in any stocks mentioned.