
Sanrio (TSE:8136) Valuation Check After Recent Share Price Weakness
Sanrio Company (TSE:8136) has quietly slipped almost 16% over the past month and roughly 30% in the past 3 months, prompting investors to reassess whether recent weakness matches the business outlook.
See our latest analysis for Sanrio Company.
Despite the recent 1 month share price return of negative 16.4 percent and a 3 month share price return of negative 29.8 percent, which signal fading momentum, Sanrio Company still boasts a standout 5 year total shareholder return close to tenfold. This suggests long term believers have been well rewarded even as near term sentiment cools.
If Sanrio’s pullback has you rethinking where growth could come from next, it might be a good time to explore fast growing stocks with high insider ownership as potential fresh ideas.
With earnings still growing and the share price now well below analyst targets, investors need to ask whether Sanrio is trading at a meaningful discount or if the market already reflects its future expansion potential.
Price-to-Earnings of 26.3x: Is it justified?
Sanrio Company currently trades on a price to earnings ratio of 26.3 times, which sits above both peer and industry averages despite the recent share price slide.
The price to earnings multiple compares the current share price with the company’s per share earnings. It is a simple shorthand for how much investors are willing to pay for each unit of profit. For a branded character and content business with strong profitability and structural growth drivers, this metric is often a key lens for judging how much of future earnings power is already embedded in the price.
Sanrio’s 26.3 times multiple is slightly below the SWS fair price to earnings estimate of 26.9 times. This suggests the current valuation is broadly aligned with what its earnings profile and growth track record would imply. However, the stock screens as expensive relative to both direct peers at 16.8 times earnings and the broader JP Specialty Retail industry at 14.1 times, indicating the market is assigning a clear premium for its faster earnings expansion and high returns on equity.
8136’s valuation premium is particularly stark when set against the industry. Its 26.3 times price to earnings ratio almost doubles the 14.1 times sector average and underscores how strongly investors are pricing its growth and profitability edge.
Explore the SWS fair ratio for Sanrio Company
Result: Price-to-Earnings of 26.3x (ABOUT RIGHT)
However, Sanrio’s premium relies on continued earnings growth. Any slowdown in consumer spending or weaker licensing demand could quickly compress its valuation.
Find out about the key risks to this Sanrio Company narrative.
Another View: Discounted Cash Flow Check
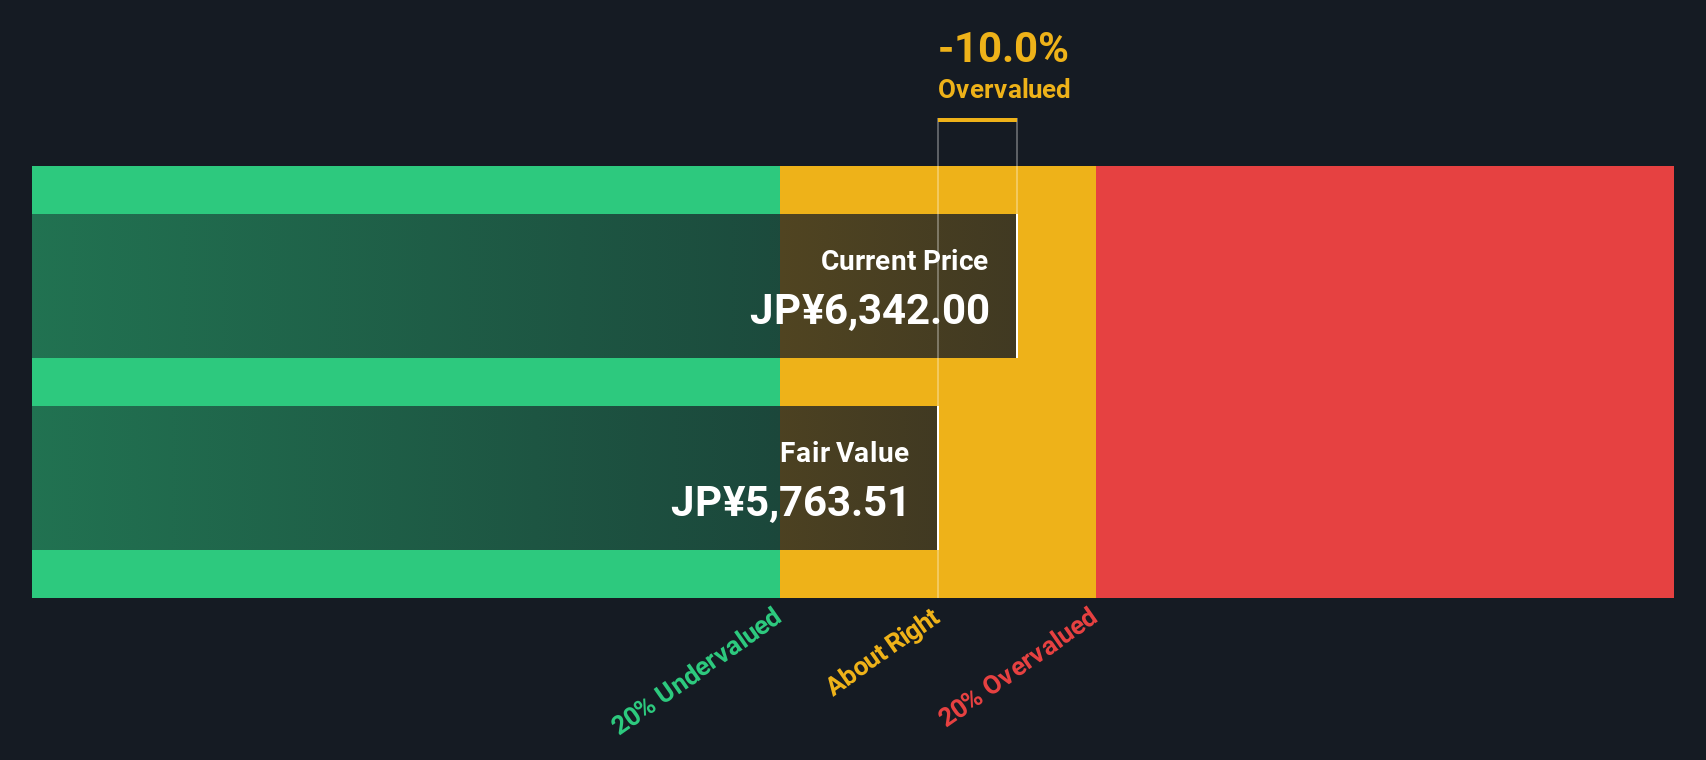
While the earnings multiple suggests Sanrio is roughly fairly priced, our DCF model paints a slightly different picture, with the shares trading about 2.9 percent below fair value. It is a modest margin, but enough to ask whether the pullback is starting to open a real opportunity.
Look into how the SWS DCF model arrives at its fair value.
Simply Wall St performs a discounted cash flow (DCF) on every stock in the world every day (check out Sanrio Company for example). We show the entire calculation in full. You can track the result in your watchlist or portfolio and be alerted when this changes, or use our stock screener to discover 909 undervalued stocks based on their cash flows. If you save a screener we even alert you when new companies match - so you never miss a potential opportunity.
Build Your Own Sanrio Company Narrative
If you are not fully convinced by this view or simply prefer to dig into the numbers yourself, you can build a personalised story in just a few minutes by starting with Do it your way.
A great starting point for your Sanrio Company research is our analysis highlighting 4 key rewards and 1 important warning sign that could impact your investment decision.
Looking for more investment ideas?
Before you move on, give yourself the edge by scanning fresh opportunities beyond Sanrio, so your next move is deliberate rather than reactive.
- Position your portfolio for potential re-rating by targeting quality names trading below intrinsic value with these 909 undervalued stocks based on cash flows.
- Ride structural growth themes in automation and data by zeroing in on innovative businesses through these 26 AI penny stocks.
- Strengthen your income stream and reduce reliance on capital gains by focusing on reliable payers via these 15 dividend stocks with yields > 3%.
This article by Simply Wall St is general in nature. We provide commentary based on historical data and analyst forecasts only using an unbiased methodology and our articles are not intended to be financial advice. It does not constitute a recommendation to buy or sell any stock, and does not take account of your objectives, or your financial situation. We aim to bring you long-term focused analysis driven by fundamental data. Note that our analysis may not factor in the latest price-sensitive company announcements or qualitative material. Simply Wall St has no position in any stocks mentioned.
Have feedback on this article? Concerned about the content? Get in touch with us directly. Alternatively, email editorial-team@simplywallst.com