
Assessing American Bitcoin After a 65.2% 2025 Slide and DCF Upside Potential
- If you are staring at American Bitcoin and wondering whether this beaten down crypto stock is quietly turning into a value play, you are not alone.
- After a brutal slide, with the share price down about 47.4% over the last week, 51.9% over the last month, and 65.2% year to date, the big question now is whether the market has overshot on the downside or is still pricing in real risks.
- Recently, American Bitcoin has stayed in focus as traders reassess high beta crypto related names alongside shifting expectations for digital asset regulation and adoption. Broader sentiment swings in Bitcoin and related infrastructure plays have added extra volatility, amplifying both the downside moves and any potential rebounds.
- Despite all that noise, American Bitcoin currently scores a 4 out of 6 on our undervaluation checks, suggesting there may be more value here than the price action implies. Next we will walk through the key valuation approaches, before finishing with an even more intuitive way to think about what this stock is really worth.
Approach 1: American Bitcoin Discounted Cash Flow (DCF) Analysis
A Discounted Cash Flow model takes American Bitcoin future cash flow projections and discounts them back to today value, aiming to estimate what the entire business is worth right now in $ terms.
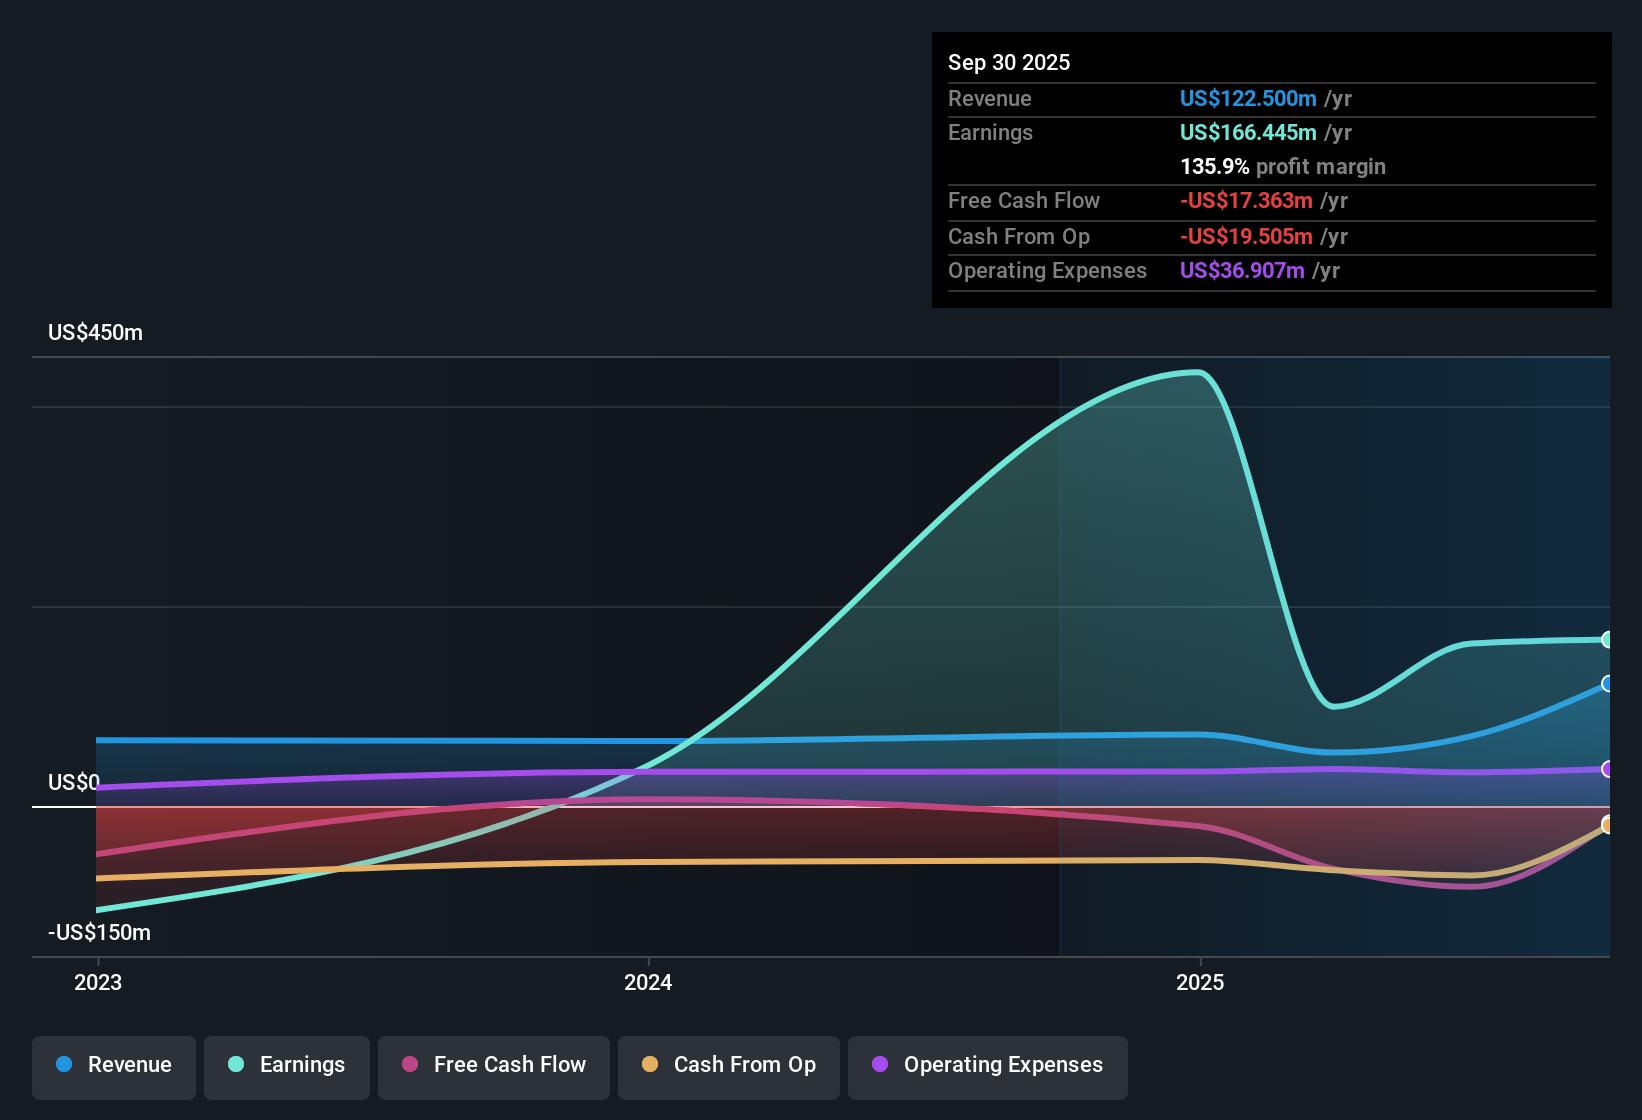
American Bitcoin last twelve months Free Cash Flow is about $26.4 Million, and the 2 Stage Free Cash Flow to Equity model used here projects this to grow significantly over the coming decade. By 2035, annual Free Cash Flow is expected to reach roughly $231.6 Million, with the early years growing especially fast as the business scales, and later years tapering to more moderate, sustainable growth. Estimates for the first few years are based on analyst expectations, while the outer years are extrapolated by Simply Wall St from those trends.
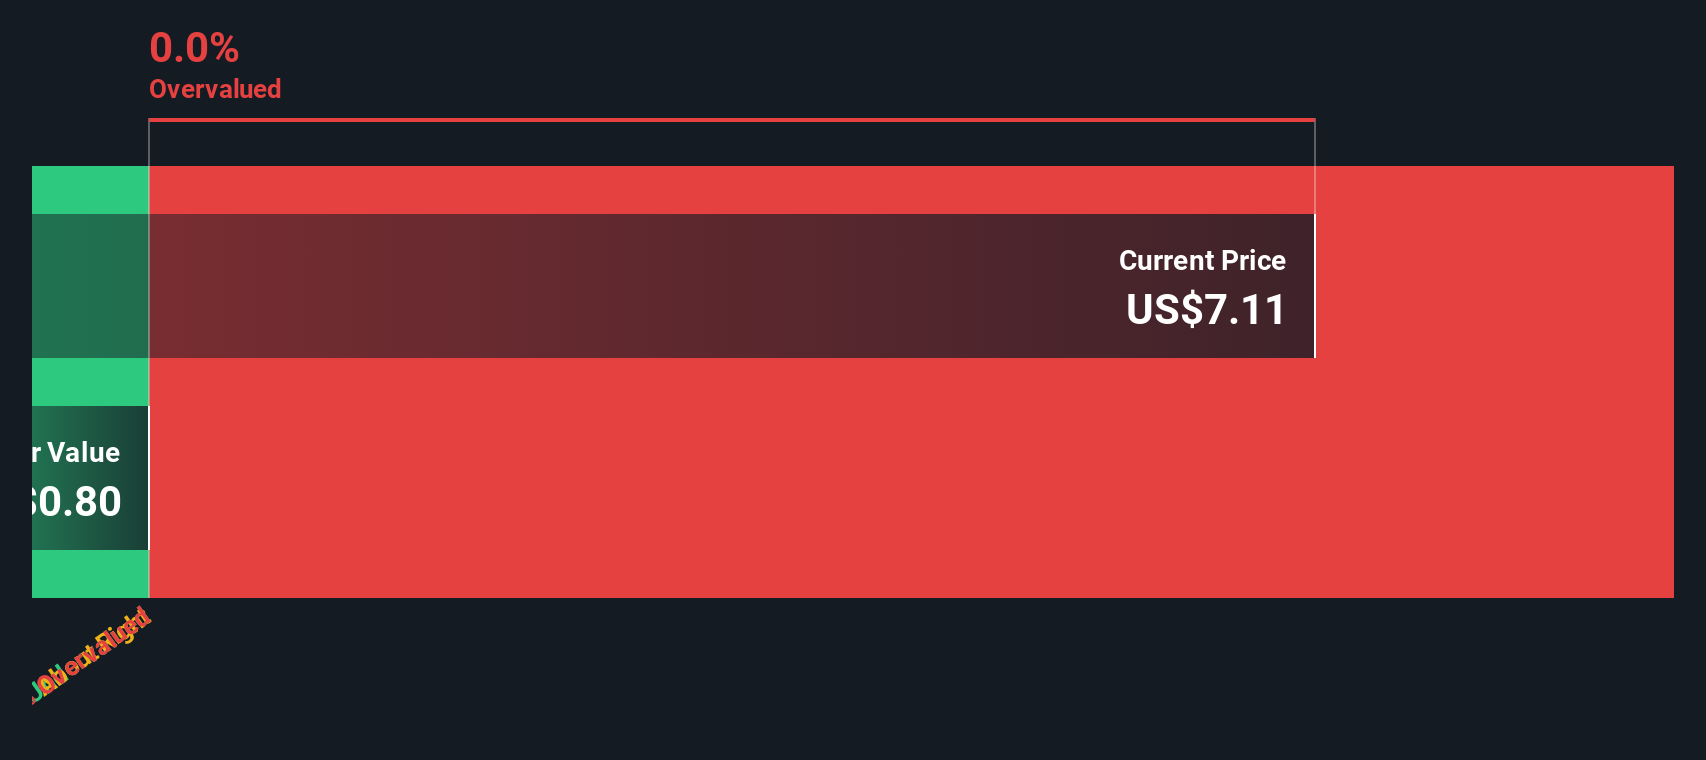
When all these projected cash flows are discounted back to today, the model arrives at an intrinsic value of about $2.99 per share. Compared with the current share price, this implies American Bitcoin is trading at roughly a 25.3% discount, suggesting meaningful upside if these cash flow forecasts prove accurate.
Result: UNDERVALUED
Our Discounted Cash Flow (DCF) analysis suggests American Bitcoin is undervalued by 25.3%. Track this in your watchlist or portfolio, or discover 907 more undervalued stocks based on cash flows.
Approach 2: American Bitcoin Price vs Earnings
For profitable companies, the price to earnings ratio is often an intuitive way to think about valuation, because it directly links what investors are paying today to the profits the business is already generating. A higher PE can be justified when the market expects faster growth or sees the earnings stream as relatively stable and low risk, while slower growth or higher uncertainty usually warrants a lower, more conservative multiple.
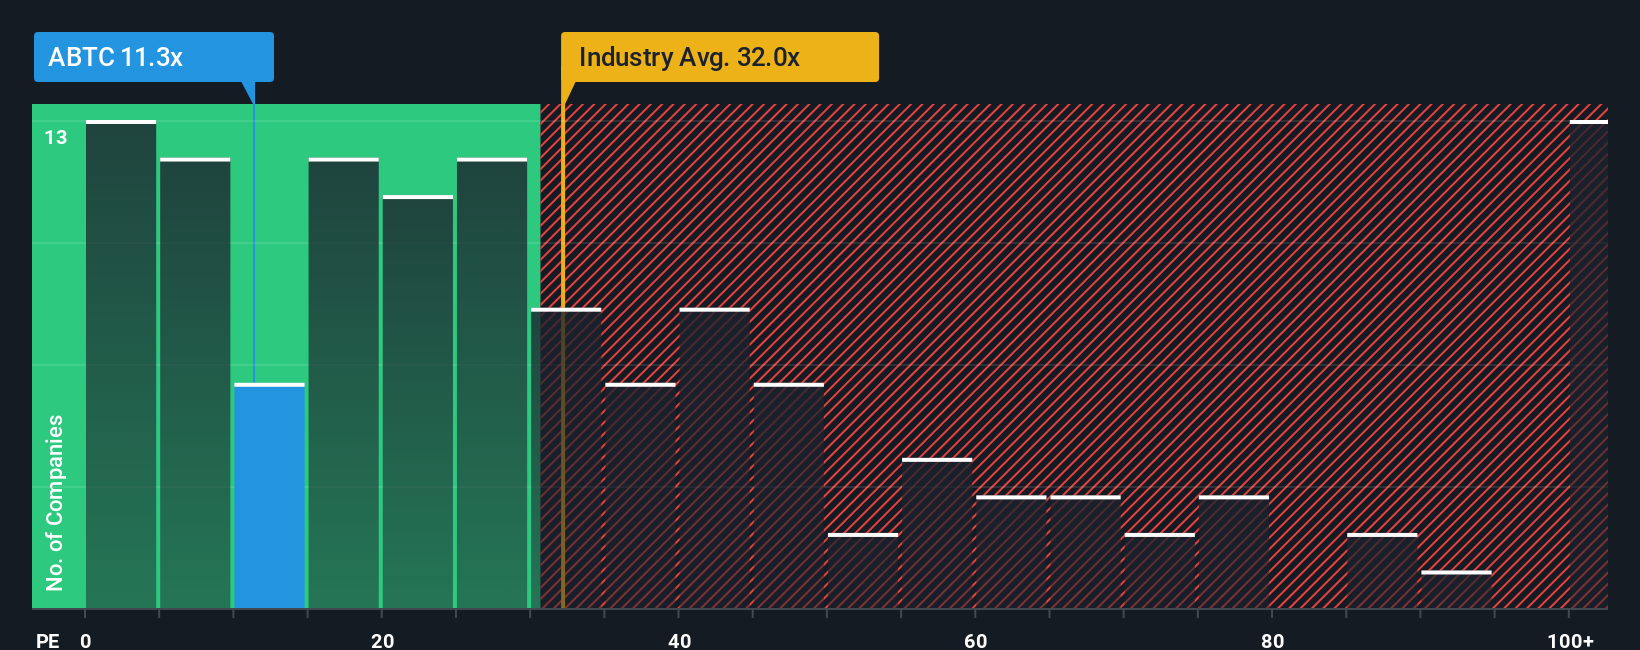
American Bitcoin currently trades on a PE of about 12.4x, which is well below both the broader Software industry average of roughly 31.5x and the peer group sitting around 98.3x. On the surface, that discount suggests investors are either cautious about the durability of current earnings or are demanding a higher risk premium due to the volatile, crypto linked business model.
To refine that view, Simply Wall St uses a proprietary Fair Ratio, which estimates the PE you might expect for American Bitcoin after adjusting for its specific earnings growth profile, profit margins, risk factors, industry dynamics and market capitalization. This can be more useful than a simple comparison with peers or the industry, which can be skewed by very high growth or highly speculative names. On this basis, American Bitcoin appears undervalued, with its actual 12.4x PE sitting below what the Fair Ratio implies would be reasonable.
Result: UNDERVALUED
PE ratios tell one story, but what if the real opportunity lies elsewhere? Discover 1452 companies where insiders are betting big on explosive growth.
Upgrade Your Decision Making: Choose your American Bitcoin Narrative
Earlier we mentioned that there is an even better way to understand valuation, so let us introduce you to Narratives, a simple framework that lets you attach a clear story, your view of a company future revenue, earnings and margins, to the numbers behind a fair value estimate. A Narrative links three things together: what you believe about American Bitcoin business and risks, how that belief translates into a financial forecast, and the fair value that drops out of those assumptions. Narratives are built directly into the Simply Wall St platform on the Community page, where millions of investors can quickly create, compare and follow different fair value views, then decide whether to buy, hold or sell by comparing each Narrative fair value to the current share price. As new information, such as earnings releases or major news, is released, the inputs and therefore the Narrative values can be updated, keeping your thesis alive rather than static. For example, one American Bitcoin Narrative might assume rapid hash rate growth, rising margins and a fair value far above today price, while another could assume tougher regulation, slower growth and a much lower fair value.
Do you think there's more to the story for American Bitcoin? Head over to our Community to see what others are saying!
This article by Simply Wall St is general in nature. We provide commentary based on historical data and analyst forecasts only using an unbiased methodology and our articles are not intended to be financial advice. It does not constitute a recommendation to buy or sell any stock, and does not take account of your objectives, or your financial situation. We aim to bring you long-term focused analysis driven by fundamental data. Note that our analysis may not factor in the latest price-sensitive company announcements or qualitative material. Simply Wall St has no position in any stocks mentioned.
Have feedback on this article? Concerned about the content? Get in touch with us directly. Alternatively, email editorial-team@simplywallst.com