
Is HP Now a Value Opportunity After Recent Cost Cutting and AI Growth Push?
- If you are wondering whether HP is quietly turning into a value opportunity, or if the market is pricing it exactly where it deserves to be, this article is going to walk you through what the numbers are really saying.
- Over the last week HP has climbed 6.1%, even though it is still down 1.4% over the past month and sits roughly 20.2% lower year to date. This naturally raises the question of whether sentiment is starting to shift.
- Recent headlines have focused on HP doubling down on cost discipline and streamlining its PC and printing operations, as well as highlighting management’s push into higher margin and recurring revenue segments like managed services and subscriptions. At the same time, analysts and commentators have been debating whether the company’s long term demand tailwinds in hybrid work and AI enabled devices can offset cyclical softness in hardware spending.
- On our framework HP scores a solid 5/6 valuation checks, suggesting the stock looks undervalued on most traditional metrics. Next we will compare those methods side by side while also pointing you to an even more powerful way to think about valuation by the end of this article.
Find out why HP's -25.5% return over the last year is lagging behind its peers.
Approach 1: HP Discounted Cash Flow (DCF) Analysis
A Discounted Cash Flow, or DCF, model estimates what a company is worth by projecting the cash it can generate in the future and discounting those cash flows back to today in dollar terms.
For HP, the latest twelve-month free cash flow is about $2.99 billion. Analysts provide detailed forecasts for the next few years, and these are then extended by Simply Wall St using a 2 Stage Free Cash Flow to Equity model, which gradually tapers growth over time. On this basis, HP’s free cash flow is projected to be around $3.08 billion by 2030, with further moderate growth thereafter.
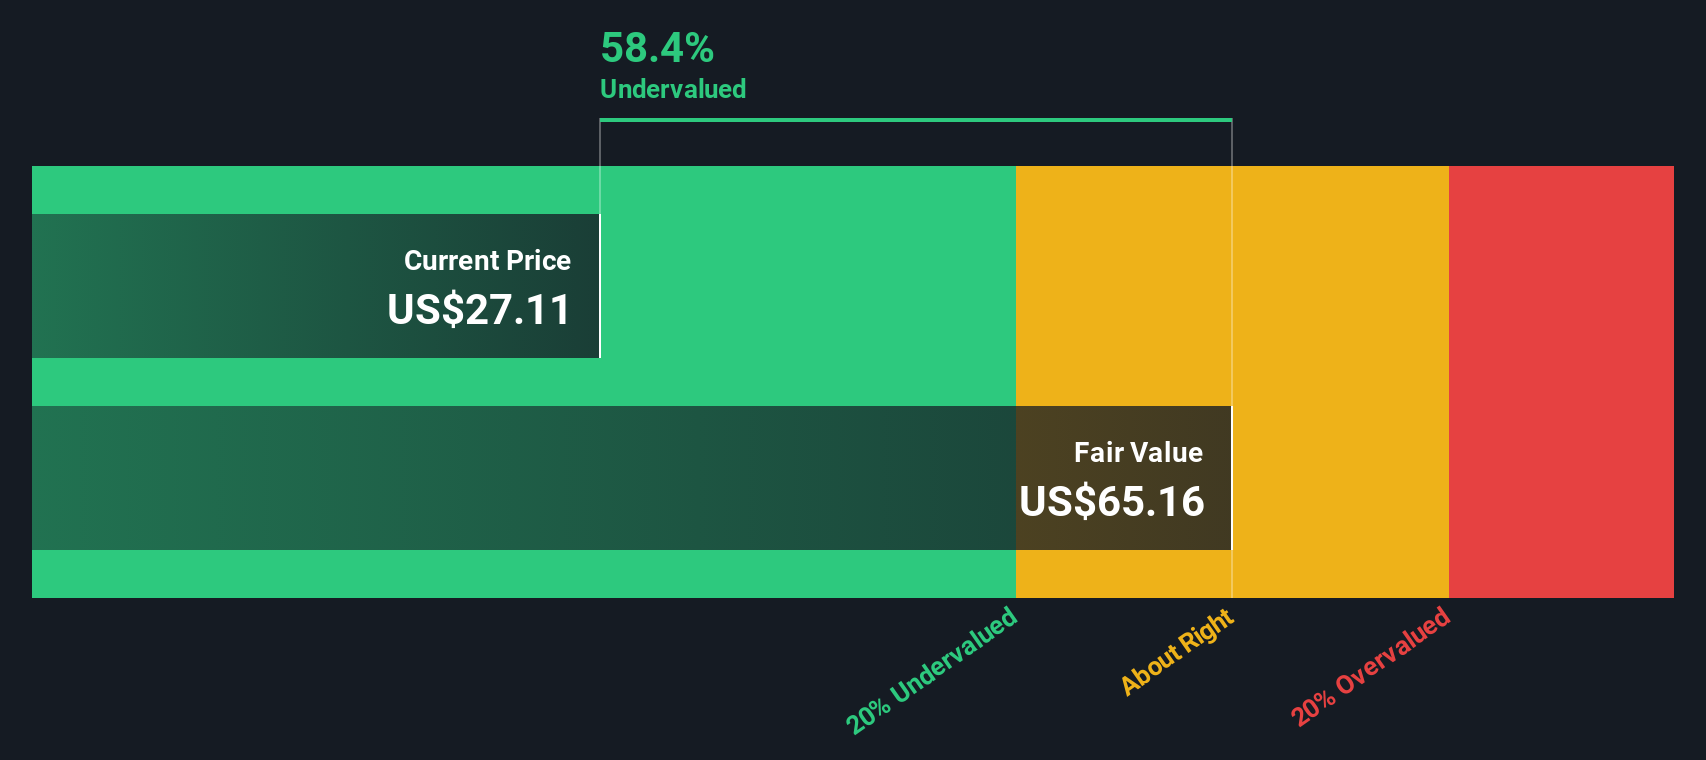
When all those future cash flows are discounted back, the model estimates an intrinsic value of about $47.38 per share. Compared with the current share price, this implies HP is trading at roughly a 45.3% discount, which indicates the market is pricing the stock well below its modeled cash flow value.
Result: UNDERVALUED
Our Discounted Cash Flow (DCF) analysis suggests HP is undervalued by 45.3%. Track this in your watchlist or portfolio, or discover 907 more undervalued stocks based on cash flows.
Approach 2: HP Price vs Earnings
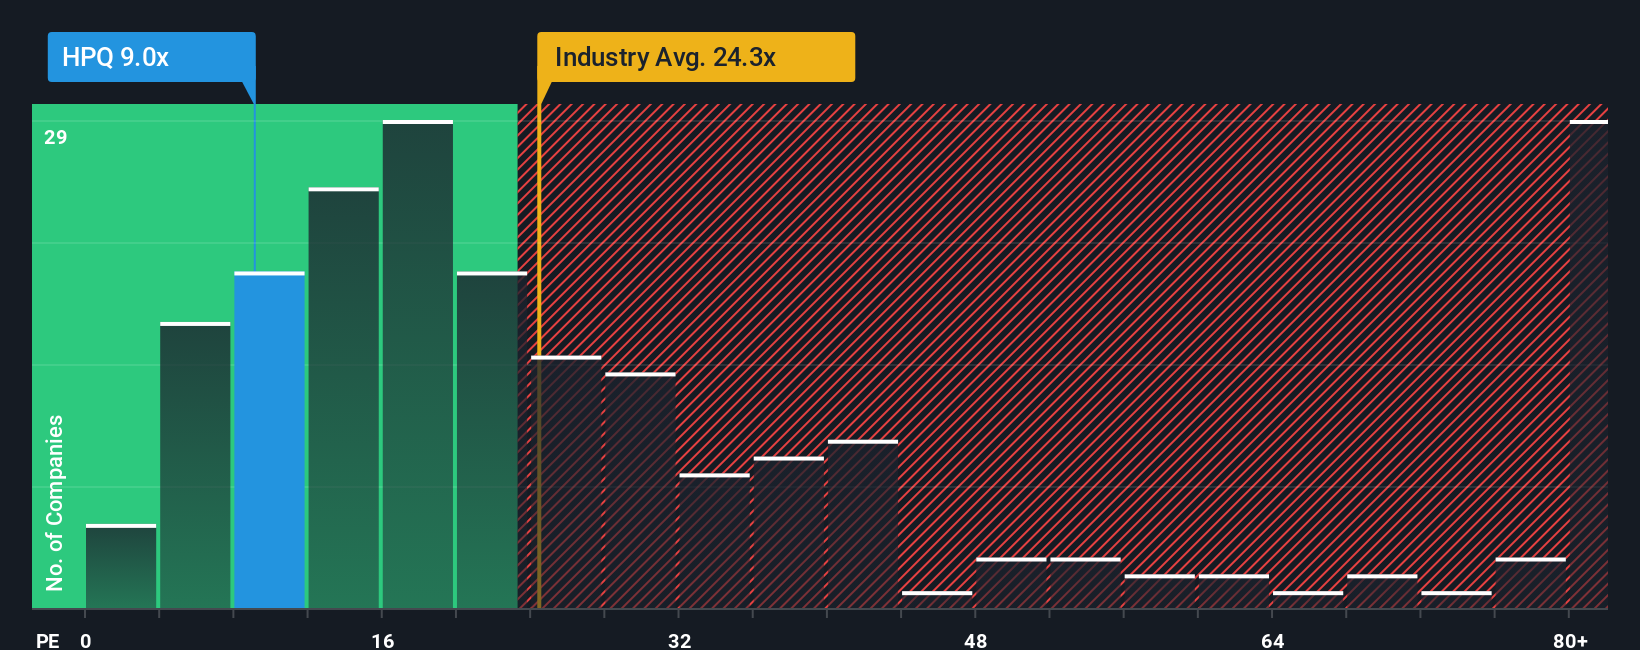
For a mature, consistently profitable business like HP, the price to earnings (PE) ratio is a practical way to gauge whether investors are paying a reasonable price for each dollar of earnings. In general, companies with stronger growth prospects and lower perceived risk tend to have a higher PE, while slower growth or higher uncertainty usually mean the market will only pay a lower multiple.
HP currently trades on a PE of about 9.6x, which is far below both the broader Tech industry average of around 22.8x and the peer group average near 63.7x. On those simple comparisons alone, the stock appears inexpensive. However, these benchmarks can be misleading because they do not fully adjust for HP’s specific growth profile, margins, scale and risk factors.
This is where Simply Wall St’s Fair Ratio comes in. It is a proprietary estimate of what HP’s PE could be, given its earnings growth outlook, profitability, industry, market capitalization and risk profile. For HP, the Fair Ratio is 23.3x, compared with the current 9.6x. That sizeable gap indicates the shares may still be pricing in a lot of pessimism relative to what the fundamentals imply.
Result: UNDERVALUED
PE ratios tell one story, but what if the real opportunity lies elsewhere? Discover 1452 companies where insiders are betting big on explosive growth.
Upgrade Your Decision Making: Choose your HP Narrative
Earlier we mentioned that there is an even better way to understand valuation. Let us introduce you to Narratives, a simple tool on Simply Wall St’s Community page that lets you attach a clear story to the numbers. It does this by connecting your assumptions about HP’s future revenue, earnings and margins to a concrete forecast and a calculated fair value. You can then compare that fair value to the current share price to help you decide whether to buy, hold or sell. Because Narratives are updated dynamically as new news or earnings arrive, they stay in sync with reality and make it easy to see how different perspectives can coexist. For example, one investor might build a bullish HP Narrative around AI driven PCs, premium devices and cost savings that support a higher fair value and an attractive discount at today’s price. Another investor might create a more cautious HP Narrative focused on structural print decline, intense price competition and supply pressures that justify a lower fair value and perhaps a smaller margin of safety or even a sell signal.
Do you think there's more to the story for HP? Head over to our Community to see what others are saying!

This article by Simply Wall St is general in nature. We provide commentary based on historical data and analyst forecasts only using an unbiased methodology and our articles are not intended to be financial advice. It does not constitute a recommendation to buy or sell any stock, and does not take account of your objectives, or your financial situation. We aim to bring you long-term focused analysis driven by fundamental data. Note that our analysis may not factor in the latest price-sensitive company announcements or qualitative material. Simply Wall St has no position in any stocks mentioned.
Have feedback on this article? Concerned about the content? Get in touch with us directly. Alternatively, email editorial-team@simplywallst.com