
THOR Industries (THO): Valuation Check After First-Quarter Earnings Rebound and Return to Profitability
THOR Industries (THO) just opened its fiscal year with a cleaner scorecard, turning last year’s small loss into a profit as first quarter sales and earnings improved across its core RV business.
See our latest analysis for THOR Industries.
The latest earnings beat and steady buybacks have not stopped some profit taking. The 90 day share price return of minus 9.96% contrasts with the five year total shareholder return of 16.95%, which points to a still constructive longer term trend.
If THOR’s comeback has you thinking about what else could surprise on the upside, it might be a good time to explore auto manufacturers for more ideas across the sector.
With earnings momentum rebuilding, a modest discount to analyst targets, and buybacks quietly shrinking the float, is THOR Industries trading below its true value, or already reflecting the recovery investors are counting on?
Price-to-Earnings of 18.9x: Is it justified?
On a Price to Earnings ratio of 18.9 times at the last close of $100.84, THOR Industries screens slightly cheaper than many direct peers but marginally richer than the wider auto group.
The price to earnings multiple compares today’s share price with the company’s per share earnings, making it a simple way to see how much investors are paying for every dollar of profit in a cyclical, earnings driven sector like recreational vehicles.
Versus its selected peer group, THOR looks attractively priced with its 18.9 times multiple sitting below the 23.8 times average. This suggests the market is not fully pricing in the forecast rebound in earnings despite stronger recent growth and improving margins.
However, against the broader Global Auto industry, that same multiple edges above the 18.6 times average. It also sits higher than the 17.2 times fair Price to Earnings level implied by our regression based fair ratio model, signaling that if sentiment cools the valuation could drift toward that lower reference point.
Explore the SWS fair ratio for THOR Industries
Result: Price-to-Earnings of 18.9x (ABOUT RIGHT)
However, there are still risks, including a consumer spending slowdown or weaker dealer orders, that could derail expectations for a smooth earnings recovery.
Find out about the key risks to this THOR Industries narrative.
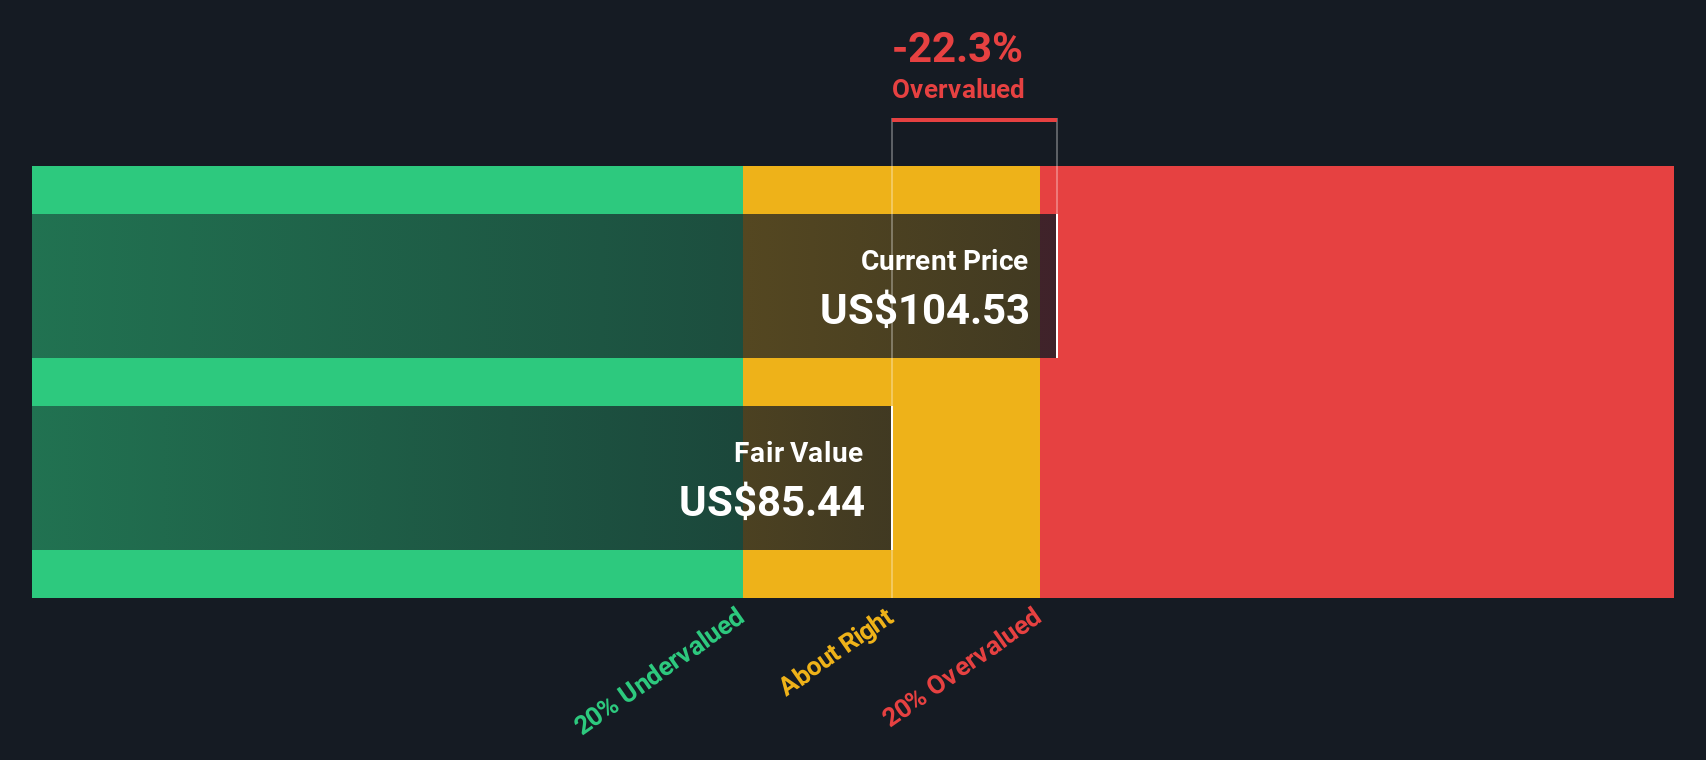
Another View: DCF Suggests There Is Still Upside
While the 18.9 times earnings multiple implies THOR Industries is roughly fairly priced, our DCF model tells a slightly different story. On that basis, the stock screens around 4.8% undervalued versus an estimated fair value of $105.89, which hints at a modest margin of safety.
Look into how the SWS DCF model arrives at its fair value.
Simply Wall St performs a discounted cash flow (DCF) on every stock in the world every day (check out THOR Industries for example). We show the entire calculation in full. You can track the result in your watchlist or portfolio and be alerted when this changes, or use our stock screener to discover 907 undervalued stocks based on their cash flows. If you save a screener we even alert you when new companies match - so you never miss a potential opportunity.
Build Your Own THOR Industries Narrative
If you see things differently, or prefer to dig into the numbers yourself, you can shape a personalized view in just a few minutes: Do it your way.
A good starting point is our analysis highlighting 4 key rewards investors are optimistic about regarding THOR Industries.
Ready for your next investing move?
Before markets shift again, lock in your next set of opportunities with targeted screens on Simply Wall St that surface strong ideas you might otherwise overlook.
- Capitalize on mispriced quality by scanning these 907 undervalued stocks based on cash flows that stand out for strong cash flows and compelling valuations.
- Ride powerful innovation trends by zeroing in on these 26 AI penny stocks that could reshape entire industries with intelligent automation.
- Boost your income potential by filtering for these 15 dividend stocks with yields > 3% that can strengthen long term total returns.
This article by Simply Wall St is general in nature. We provide commentary based on historical data and analyst forecasts only using an unbiased methodology and our articles are not intended to be financial advice. It does not constitute a recommendation to buy or sell any stock, and does not take account of your objectives, or your financial situation. We aim to bring you long-term focused analysis driven by fundamental data. Note that our analysis may not factor in the latest price-sensitive company announcements or qualitative material. Simply Wall St has no position in any stocks mentioned.
Have feedback on this article? Concerned about the content? Get in touch with us directly. Alternatively, email editorial-team@simplywallst.com