
Trisura Group (TSX:TSU) Valuation Check After Renewed Share Buyback Plan
Trisura Group (TSX:TSU) just renewed its Normal Course Issuer Bid, giving itself room to buy back up to roughly 3% of its shares over the next year, a shareholder friendly capital decision.
See our latest analysis for Trisura Group.
The refreshed buyback comes after a steady, if unspectacular, stretch where Trisura’s share price has inched up year to date while the 1 year total shareholder return has stayed modestly negative, hinting that sentiment may be stabilising rather than surging.
If this kind of capital return story interests you, it could be worth seeing what else is out there by exploring fast growing stocks with high insider ownership.
With shares still below analyst targets but long term returns strong, are investors getting Trisura at a reasonable discount today, or is the market already baking in the next leg of earnings growth?
Most Popular Narrative: 26.8% Undervalued
Compared to Trisura Group’s last close at CA$39.75, the most followed narrative points to a meaningfully higher fair value based on medium term earnings power.
The rapid expansion and scaling of Trisura's U.S. specialty insurance and surety platforms are opening access to a much larger addressable market, supported by a recent $40 million capital injection that enables participation in larger bonding projects and greater premium growth. This is expected to drive substantial increases in revenue and, over time, enhanced net margins through operational leverage.
Curious how steady, mid teens earnings growth, rising margins and a richer future multiple combine into that upside case? The full narrative reveals the playbook.
Result: Fair Value of $54.29 (UNDERVALUED)
Have a read of the narrative in full and understand what's behind the forecasts.
However, that upside depends on careful execution. Missteps in US expansion or heavier catastrophe losses could easily pressure margins and stall the growth story.
Find out about the key risks to this Trisura Group narrative.
Another Way to Look at Value
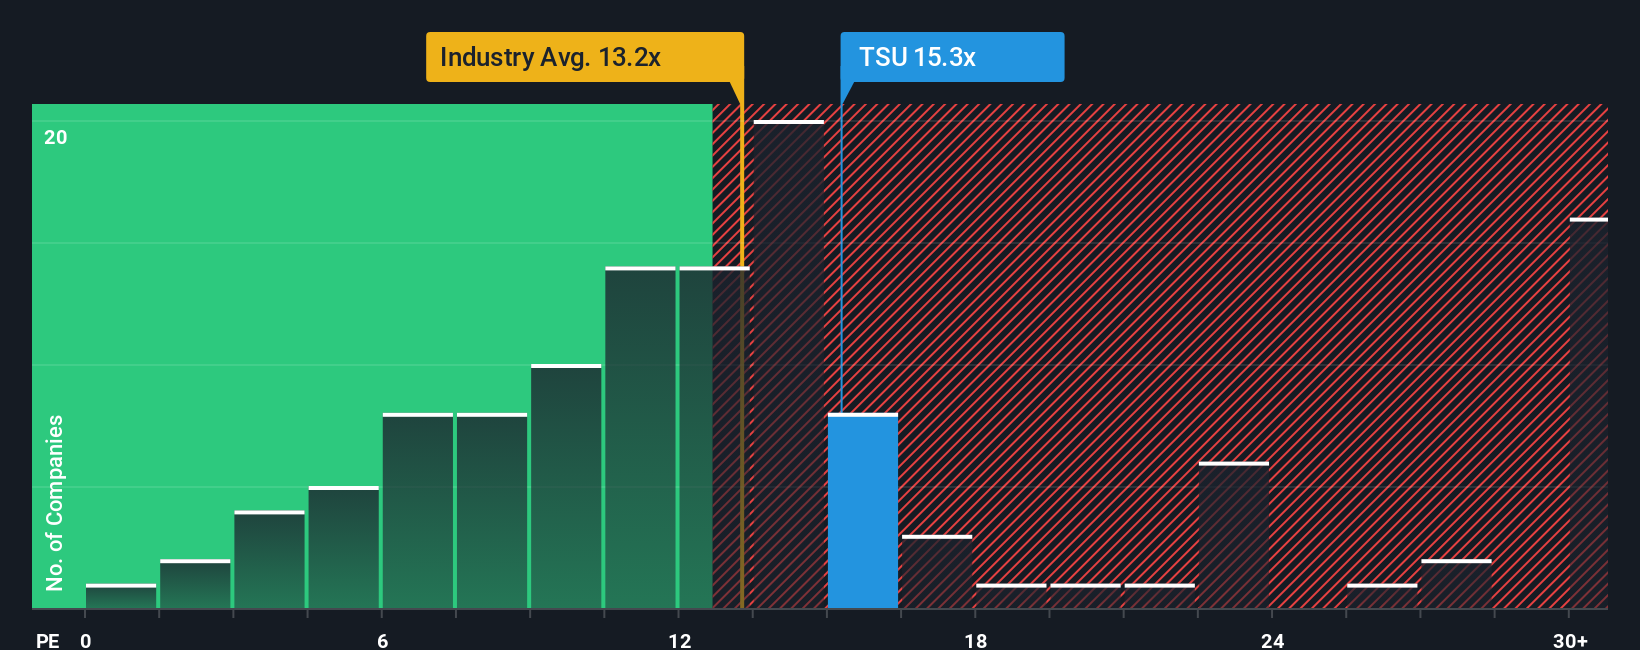
On earnings, Trisura actually screens as pricey, trading at about 15.3 times profit versus 13.2 times for the wider North American insurance group and 12 times for peers, and even above its 14.9 fair ratio, suggesting less margin of safety if growth ever disappoints.
See what the numbers say about this price — find out in our valuation breakdown.
Build Your Own Trisura Group Narrative
If you see the numbers differently or want to stress test your own assumptions, you can build a personalised narrative in just minutes: Do it your way.
A good starting point is our analysis highlighting 4 key rewards investors are optimistic about regarding Trisura Group.
Looking for more investment ideas?
Do not stop with a single insurance name when you can quickly scan fresh opportunities across sectors, valuations and themes using the Simply Wall St Screener today.
- Capture potential mispricings by reviewing these 907 undervalued stocks based on cash flows that the market has not fully recognised yet.
- Tap into secular tech trends by scanning these 26 AI penny stocks positioned to benefit from accelerating adoption of artificial intelligence.
- Strengthen your income stream by evaluating these 15 dividend stocks with yields > 3% that can support long term total returns.
This article by Simply Wall St is general in nature. We provide commentary based on historical data and analyst forecasts only using an unbiased methodology and our articles are not intended to be financial advice. It does not constitute a recommendation to buy or sell any stock, and does not take account of your objectives, or your financial situation. We aim to bring you long-term focused analysis driven by fundamental data. Note that our analysis may not factor in the latest price-sensitive company announcements or qualitative material. Simply Wall St has no position in any stocks mentioned.
Have feedback on this article? Concerned about the content? Get in touch with us directly. Alternatively, email editorial-team@simplywallst.com