
Is Fiserv Now an Opportunity After Its Sharp Share Price Decline and Recent Rebound?
- If you are wondering whether Fiserv is quietly turning into a bargain or a value trap, you are in the right place to unpack what the current share price is really telling us.
- Despite a tough longer term picture, with the share price down around 68% over the past year and 42.3% over five years, the stock has snapped back 7.8% in the last week and 4.1% over the past month from a last close of $66.28, which may hint at shifting sentiment.
- Recent headlines around digital payments adoption and ongoing consolidation in financial technology have refocused attention on Fiserv's role as a key infrastructure provider, especially as investors reassess which platforms have staying power. At the same time, market chatter around competition from newer fintech entrants has injected a fresh dose of caution, helping explain why the stock still trades as if the jury is out.
- On our numbers, Fiserv scores a solid 5/6 valuation score, suggesting it screens as undervalued on most checks. Next, we will walk through the main valuation approaches we use, before finishing with an even more powerful way to think about what this stock is really worth.
Find out why Fiserv's -68.0% return over the last year is lagging behind its peers.
Approach 1: Fiserv Excess Returns Analysis
The Excess Returns model looks at how much profit Fiserv can generate above the return that investors require on their capital, then capitalizes those extra profits into a per share value today.
In this framework, Fiserv starts with a Book Value of $46.78 per share and a Stable EPS of $9.75 per share, based on weighted future Return on Equity estimates from 8 analysts. With an Average Return on Equity of 17.03% and a Cost of Equity of $5.16 per share, the company is expected to produce an Excess Return of $4.59 per share, meaning its investments are projected to earn well above the required shareholder return.
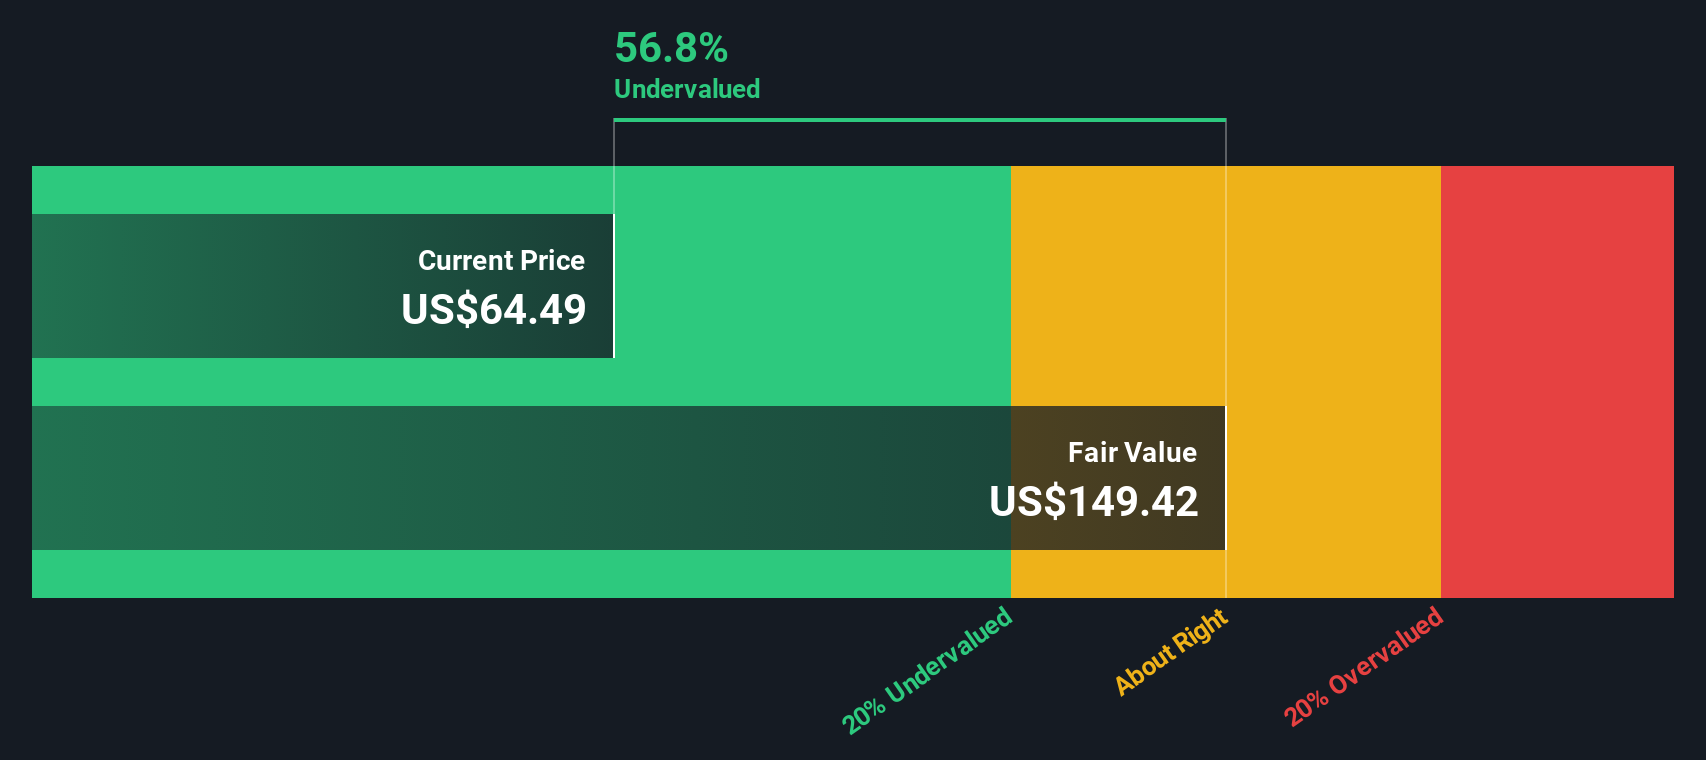
The model also assumes Fiserv’s asset base grows toward a Stable Book Value of $57.23 per share, reflecting analyst projections from 4 sources. When these excess returns are projected forward and discounted, the Excess Returns valuation points to an intrinsic value of about $137 per share, implying the stock is roughly 51.7% undervalued versus the recent price of $66.28.
Result: UNDERVALUED
Our Excess Returns analysis suggests Fiserv is undervalued by 51.7%. Track this in your watchlist or portfolio, or discover 908 more undervalued stocks based on cash flows.
Approach 2: Fiserv Price vs Earnings
For a consistently profitable business like Fiserv, the price to earnings, or PE, ratio is a useful yardstick because it links what investors pay today to the earnings the company is already generating. In general, higher expected growth and lower perceived risk justify a higher PE ratio. Conversely, slower growth and higher risk usually mean a lower, more conservative multiple is appropriate.
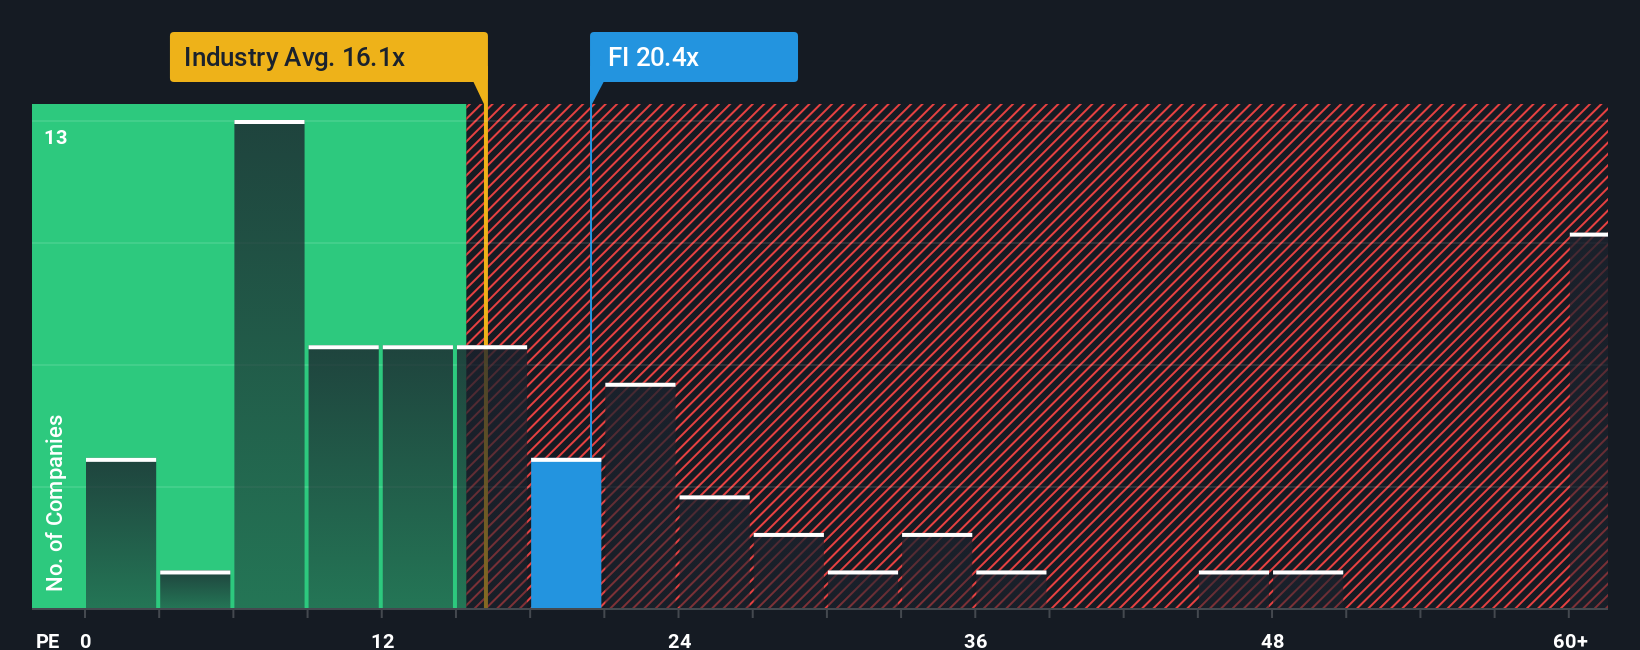
Fiserv currently trades on a PE of about 9.88x, which is well below both the Diversified Financial industry average of roughly 13.64x and the broader peer group average of around 59.85x. Simply Wall St’s Fair Ratio framework goes a step further by estimating what PE multiple Fiserv should trade on, given its specific earnings growth outlook, profit margins, market capitalization, industry positioning and risk profile. On this basis, Fiserv’s Fair Ratio is 19.95x, meaning the shares look inexpensive even after adjusting for these company specific factors, rather than just comparing headline multiples with peers.
Result: UNDERVALUED
PE ratios tell one story, but what if the real opportunity lies elsewhere? Discover 1452 companies where insiders are betting big on explosive growth.
Upgrade Your Decision Making: Choose Your Fiserv Narrative
Earlier we mentioned that there is an even better way to understand valuation, so let us introduce you to Narratives. These are simply your story about a company linked directly to a set of numbers, such as your assumptions for Fiserv’s future revenue, earnings, margins and the fair value you think those will justify.
A Narrative on Simply Wall St connects three things in one place: the business story you believe, the financial forecast that flows from that story, and the fair value those forecasts imply. This makes it easier to see whether your view suggests the stock is cheap or expensive compared with today’s price.
These Narratives live inside the Community page on Simply Wall St’s platform, which is used by millions of investors. There you can quickly set or adjust your assumptions and then compare the Fair Value that results from your Narrative with Fiserv’s current share price to assess whether it looks like a buy, a hold, or a sell.
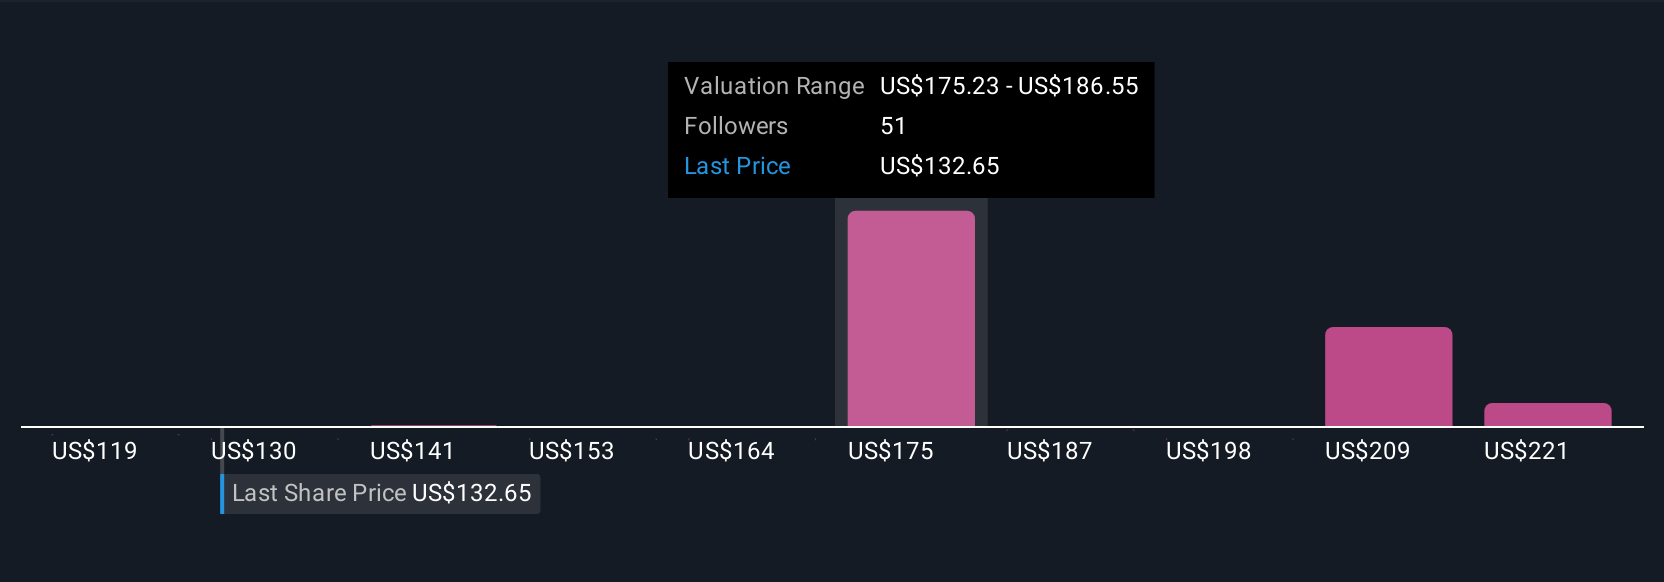
Because Narratives update as new information arrives, such as earnings results, guidance changes or news on lawsuits and regulation, a more optimistic investor might plug in faster revenue growth and a target closer to $250, while a more cautious investor might lean toward $125. Both can instantly see how their differing perspectives change Fiserv’s Fair Value and the gap to the current price.
Do you think there's more to the story for Fiserv? Head over to our Community to see what others are saying!
This article by Simply Wall St is general in nature. We provide commentary based on historical data and analyst forecasts only using an unbiased methodology and our articles are not intended to be financial advice. It does not constitute a recommendation to buy or sell any stock, and does not take account of your objectives, or your financial situation. We aim to bring you long-term focused analysis driven by fundamental data. Note that our analysis may not factor in the latest price-sensitive company announcements or qualitative material. Simply Wall St has no position in any stocks mentioned.
Have feedback on this article? Concerned about the content? Get in touch with us directly. Alternatively, email editorial-team@simplywallst.com