
With 3.7% one-year returns, institutional owners may ignore Temple & Webster Group Ltd's (ASX:TPW) 11% stock price decline
Key Insights
- Significantly high institutional ownership implies Temple & Webster Group's stock price is sensitive to their trading actions
- A total of 9 investors have a majority stake in the company with 51% ownership
- Recent purchases by insiders
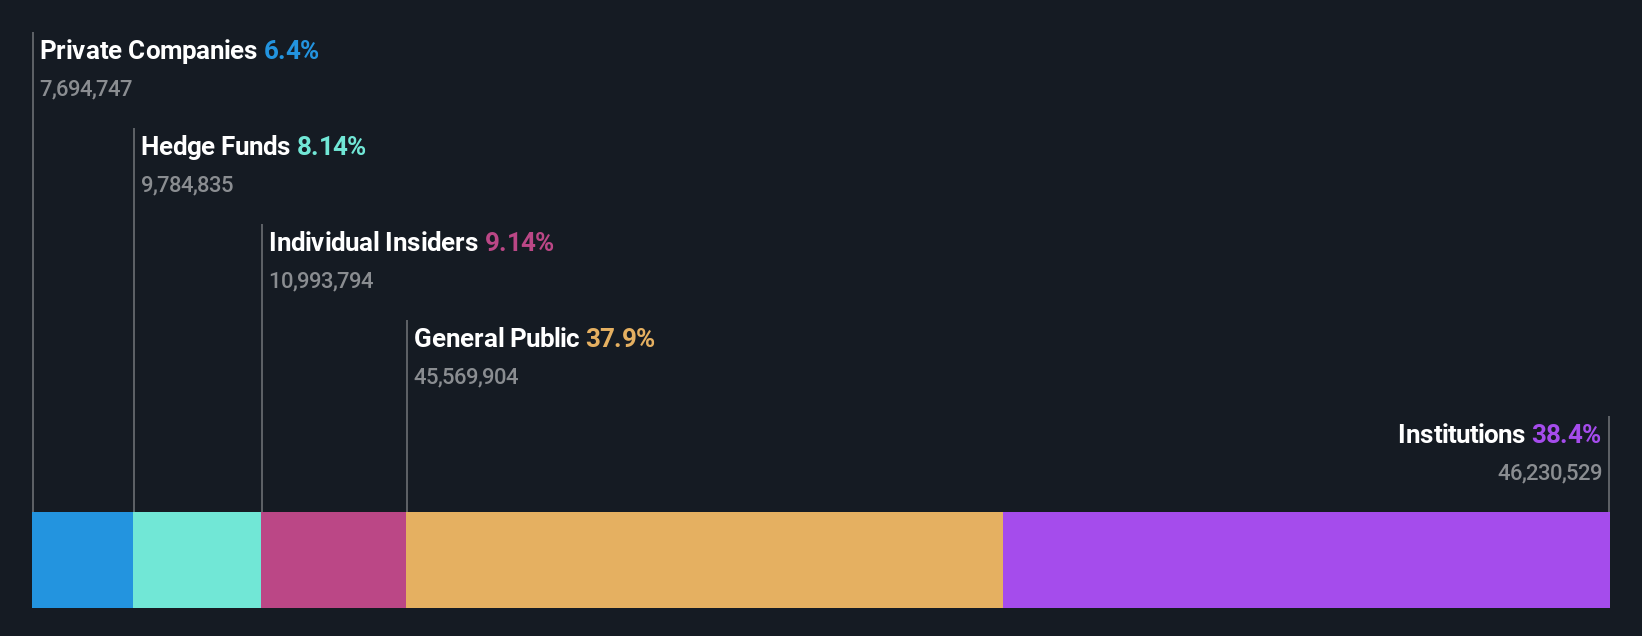
A look at the shareholders of Temple & Webster Group Ltd (ASX:TPW) can tell us which group is most powerful. The group holding the most number of shares in the company, around 38% to be precise, is institutions. In other words, the group stands to gain the most (or lose the most) from their investment into the company.
Institutional investors was the group most impacted after the company's market cap fell to AU$1.7b last week. Still, the 3.7% one-year gains may have helped mitigate their overall losses. But they would probably be wary of future losses.
In the chart below, we zoom in on the different ownership groups of Temple & Webster Group.
See our latest analysis for Temple & Webster Group
What Does The Institutional Ownership Tell Us About Temple & Webster Group?
Institutions typically measure themselves against a benchmark when reporting to their own investors, so they often become more enthusiastic about a stock once it's included in a major index. We would expect most companies to have some institutions on the register, especially if they are growing.
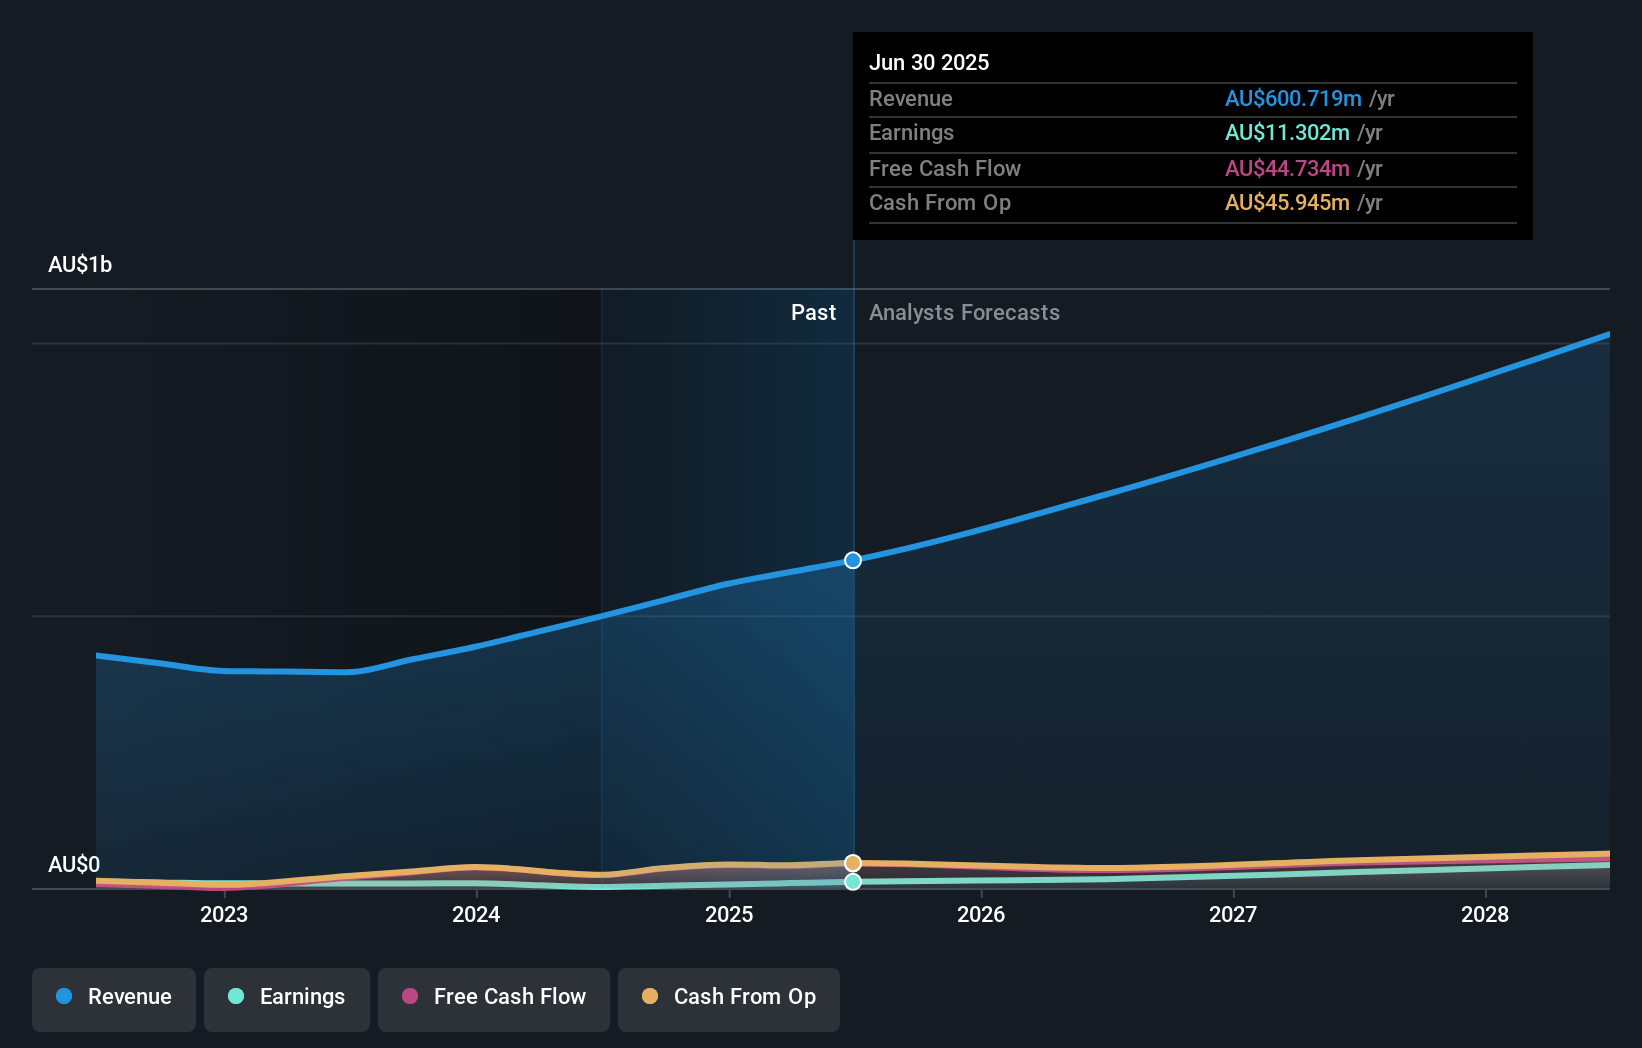
We can see that Temple & Webster Group does have institutional investors; and they hold a good portion of the company's stock. This suggests some credibility amongst professional investors. But we can't rely on that fact alone since institutions make bad investments sometimes, just like everyone does. When multiple institutions own a stock, there's always a risk that they are in a 'crowded trade'. When such a trade goes wrong, multiple parties may compete to sell stock fast. This risk is higher in a company without a history of growth. You can see Temple & Webster Group's historic earnings and revenue below, but keep in mind there's always more to the story.
It would appear that 8.1% of Temple & Webster Group shares are controlled by hedge funds. That worth noting, since hedge funds are often quite active investors, who may try to influence management. Many want to see value creation (and a higher share price) in the short term or medium term. Looking at our data, we can see that the largest shareholder is Australian Super Pty Ltd with 10% of shares outstanding. Meanwhile, the second and third largest shareholders, hold 8.1% and 5.3%, of the shares outstanding, respectively.
We did some more digging and found that 9 of the top shareholders account for roughly 51% of the register, implying that along with larger shareholders, there are a few smaller shareholders, thereby balancing out each others interests somewhat.
While it makes sense to study institutional ownership data for a company, it also makes sense to study analyst sentiments to know which way the wind is blowing. There are plenty of analysts covering the stock, so it might be worth seeing what they are forecasting, too.
Insider Ownership Of Temple & Webster Group
While the precise definition of an insider can be subjective, almost everyone considers board members to be insiders. The company management answer to the board and the latter should represent the interests of shareholders. Notably, sometimes top-level managers are on the board themselves.
Most consider insider ownership a positive because it can indicate the board is well aligned with other shareholders. However, on some occasions too much power is concentrated within this group.
Shareholders would probably be interested to learn that insiders own shares in Temple & Webster Group Ltd. It is a pretty big company, so it is generally a positive to see some potentially meaningful alignment. In this case, they own around AU$152m worth of shares (at current prices). If you would like to explore the question of insider alignment, you can click here to see if insiders have been buying or selling.
General Public Ownership
The general public-- including retail investors -- own 38% stake in the company, and hence can't easily be ignored. While this group can't necessarily call the shots, it can certainly have a real influence on how the company is run.
Private Company Ownership
It seems that Private Companies own 6.4%, of the Temple & Webster Group stock. It might be worth looking deeper into this. If related parties, such as insiders, have an interest in one of these private companies, that should be disclosed in the annual report. Private companies may also have a strategic interest in the company.
Next Steps:
While it is well worth considering the different groups that own a company, there are other factors that are even more important.
I like to dive deeper into how a company has performed in the past. You can access this interactive graph of past earnings, revenue and cash flow, for free.
If you would prefer discover what analysts are predicting in terms of future growth, do not miss this free report on analyst forecasts.
NB: Figures in this article are calculated using data from the last twelve months, which refer to the 12-month period ending on the last date of the month the financial statement is dated. This may not be consistent with full year annual report figures.
Have feedback on this article? Concerned about the content? Get in touch with us directly. Alternatively, email editorial-team (at) simplywallst.com.
This article by Simply Wall St is general in nature. We provide commentary based on historical data and analyst forecasts only using an unbiased methodology and our articles are not intended to be financial advice. It does not constitute a recommendation to buy or sell any stock, and does not take account of your objectives, or your financial situation. We aim to bring you long-term focused analysis driven by fundamental data. Note that our analysis may not factor in the latest price-sensitive company announcements or qualitative material. Simply Wall St has no position in any stocks mentioned.