
Investors who have held Pan Ocean (KRX:028670) over the last three years have watched its earnings decline along with their investment
This week we saw the Pan Ocean Co., Ltd. (KRX:028670) share price climb by 14%. But that doesn't change the fact that the returns over the last three years have been less than pleasing. After all, the share price is down 28% in the last three years, significantly under-performing the market.
On a more encouraging note the company has added ₩273b to its market cap in just the last 7 days, so let's see if we can determine what's driven the three-year loss for shareholders.
While the efficient markets hypothesis continues to be taught by some, it has been proven that markets are over-reactive dynamic systems, and investors are not always rational. One imperfect but simple way to consider how the market perception of a company has shifted is to compare the change in the earnings per share (EPS) with the share price movement.
During the three years that the share price fell, Pan Ocean's earnings per share (EPS) dropped by 34% each year. This fall in the EPS is worse than the 10% compound annual share price fall. So, despite the prior disappointment, shareholders must have some confidence the situation will improve, longer term.
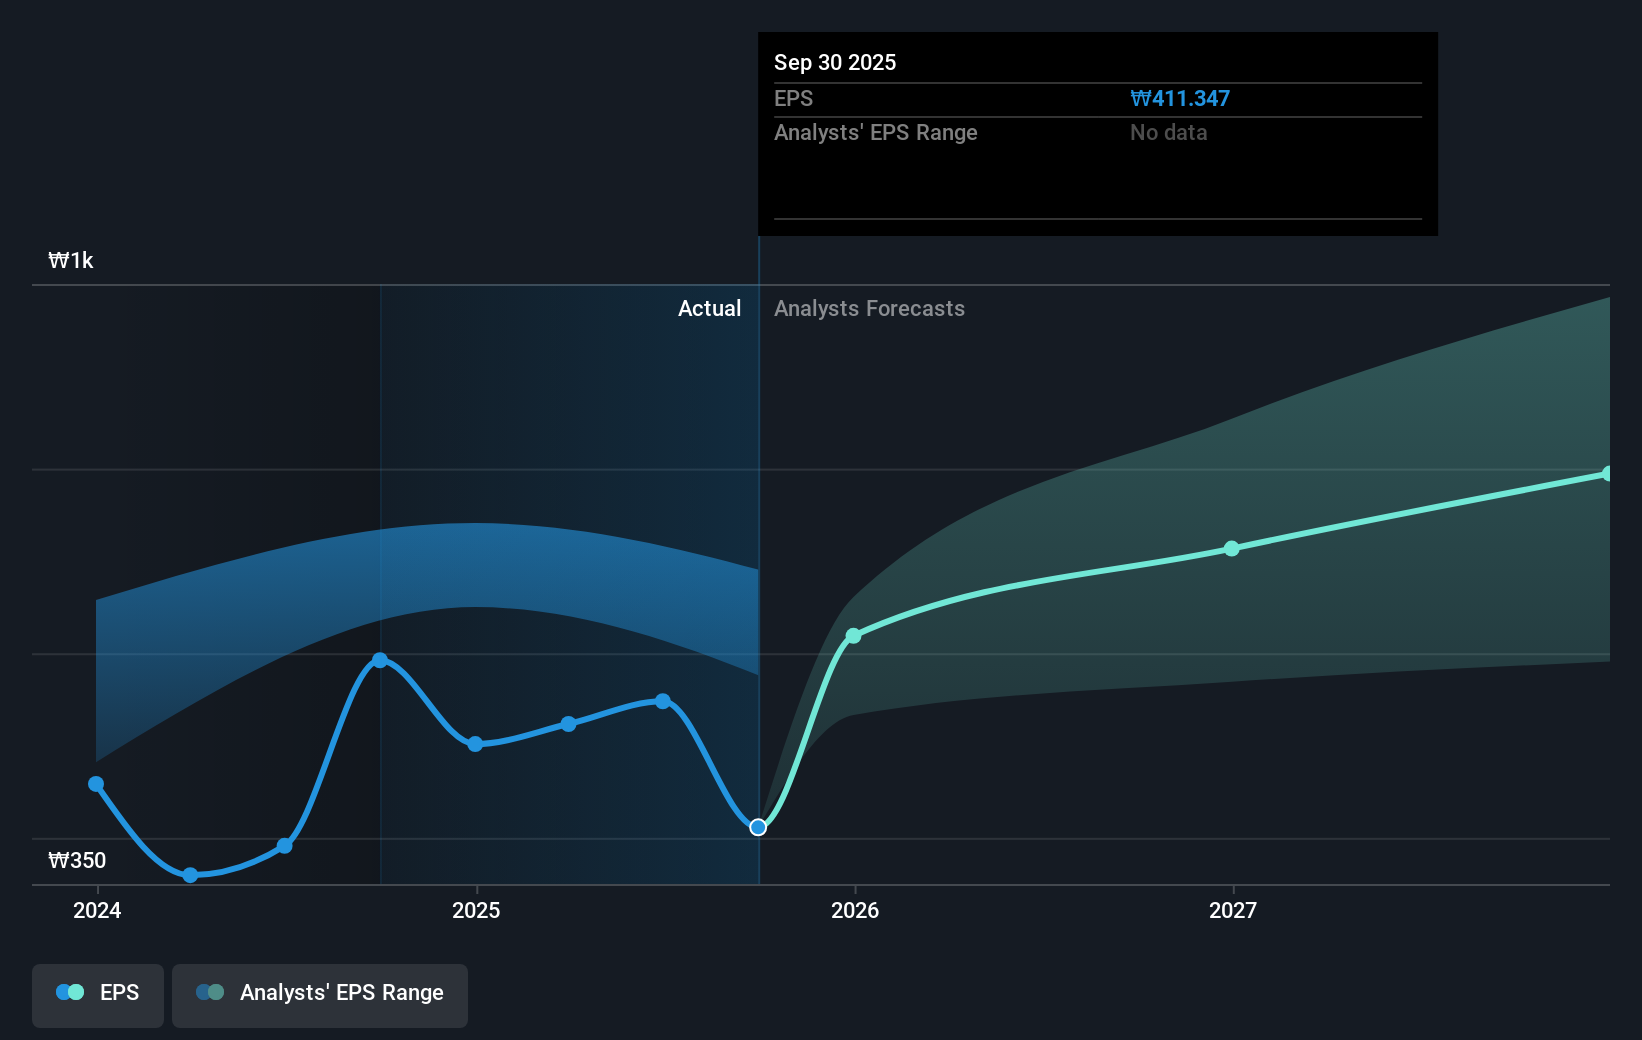
The image below shows how EPS has tracked over time (if you click on the image you can see greater detail).
Dive deeper into Pan Ocean's key metrics by checking this interactive graph of Pan Ocean's earnings, revenue and cash flow.
What About Dividends?
It is important to consider the total shareholder return, as well as the share price return, for any given stock. The TSR is a return calculation that accounts for the value of cash dividends (assuming that any dividend received was reinvested) and the calculated value of any discounted capital raisings and spin-offs. Arguably, the TSR gives a more comprehensive picture of the return generated by a stock. We note that for Pan Ocean the TSR over the last 3 years was -22%, which is better than the share price return mentioned above. This is largely a result of its dividend payments!
A Different Perspective
Pan Ocean provided a TSR of 32% over the last twelve months. But that was short of the market average. The silver lining is that the gain was actually better than the average annual return of 3% per year over five year. It is possible that returns will improve along with the business fundamentals. I find it very interesting to look at share price over the long term as a proxy for business performance. But to truly gain insight, we need to consider other information, too. Case in point: We've spotted 3 warning signs for Pan Ocean you should be aware of.
If you would prefer to check out another company -- one with potentially superior financials -- then do not miss this free list of companies that have proven they can grow earnings.
Please note, the market returns quoted in this article reflect the market weighted average returns of stocks that currently trade on South Korean exchanges.
Have feedback on this article? Concerned about the content? Get in touch with us directly. Alternatively, email editorial-team (at) simplywallst.com.
This article by Simply Wall St is general in nature. We provide commentary based on historical data and analyst forecasts only using an unbiased methodology and our articles are not intended to be financial advice. It does not constitute a recommendation to buy or sell any stock, and does not take account of your objectives, or your financial situation. We aim to bring you long-term focused analysis driven by fundamental data. Note that our analysis may not factor in the latest price-sensitive company announcements or qualitative material. Simply Wall St has no position in any stocks mentioned.