
Is It Too Late to Consider Baytex Energy After Its Recent 27.8% Share Price Jump?
- Wondering if Baytex Energy is actually good value at today’s price, or if you have already missed the big move? You are not alone. This breakdown is designed to give you a clear, no nonsense view.
- The stock is flat over the last week, but up 27.8% over the past month, 18.4% year to date, and 26.8% over the last year, while still sitting on a hefty 487.5% gain over five years despite a choppy 3 year stretch at -18.1%.
- Those swings have come against a backdrop of shifting oil price expectations, ongoing Canadian energy sector consolidation, and Baytex working to integrate prior acquisitions while managing its balance sheet discipline. At the same time, investors have been re rating names with leverage to crude prices and free cash flow, which helps explain why sentiment around Baytex has warmed up again.
- On our checklist of six valuation tests, Baytex scores a 3 out of 6, suggesting the market might be underestimating parts of the story, but not all of it. We will walk through those methods next before finishing with a more complete way to think about what the stock is really worth.
Approach 1: Baytex Energy Discounted Cash Flow (DCF) Analysis
The Discounted Cash Flow model estimates what a company is worth by projecting the cash it can generate in the future and discounting those cash flows back to today. For Baytex Energy, this means taking expected future Free Cash Flow in CA$, adjusting it for risk and time, and summing it to arrive at an intrinsic value per share.
Baytex generated roughly CA$488.8 Million in Free Cash Flow over the last twelve months. Analysts provide only a few years of explicit forecasts, so Simply Wall St extends these into a 2 Stage Free Cash Flow to Equity model, with early years reflecting more volatile estimates, then transitioning into steadier, extrapolated growth. Under this framework, Free Cash Flow is projected to grow from negative or modest levels in the near term to around CA$576.8 Million by 2035, all in today’s money after discounting.
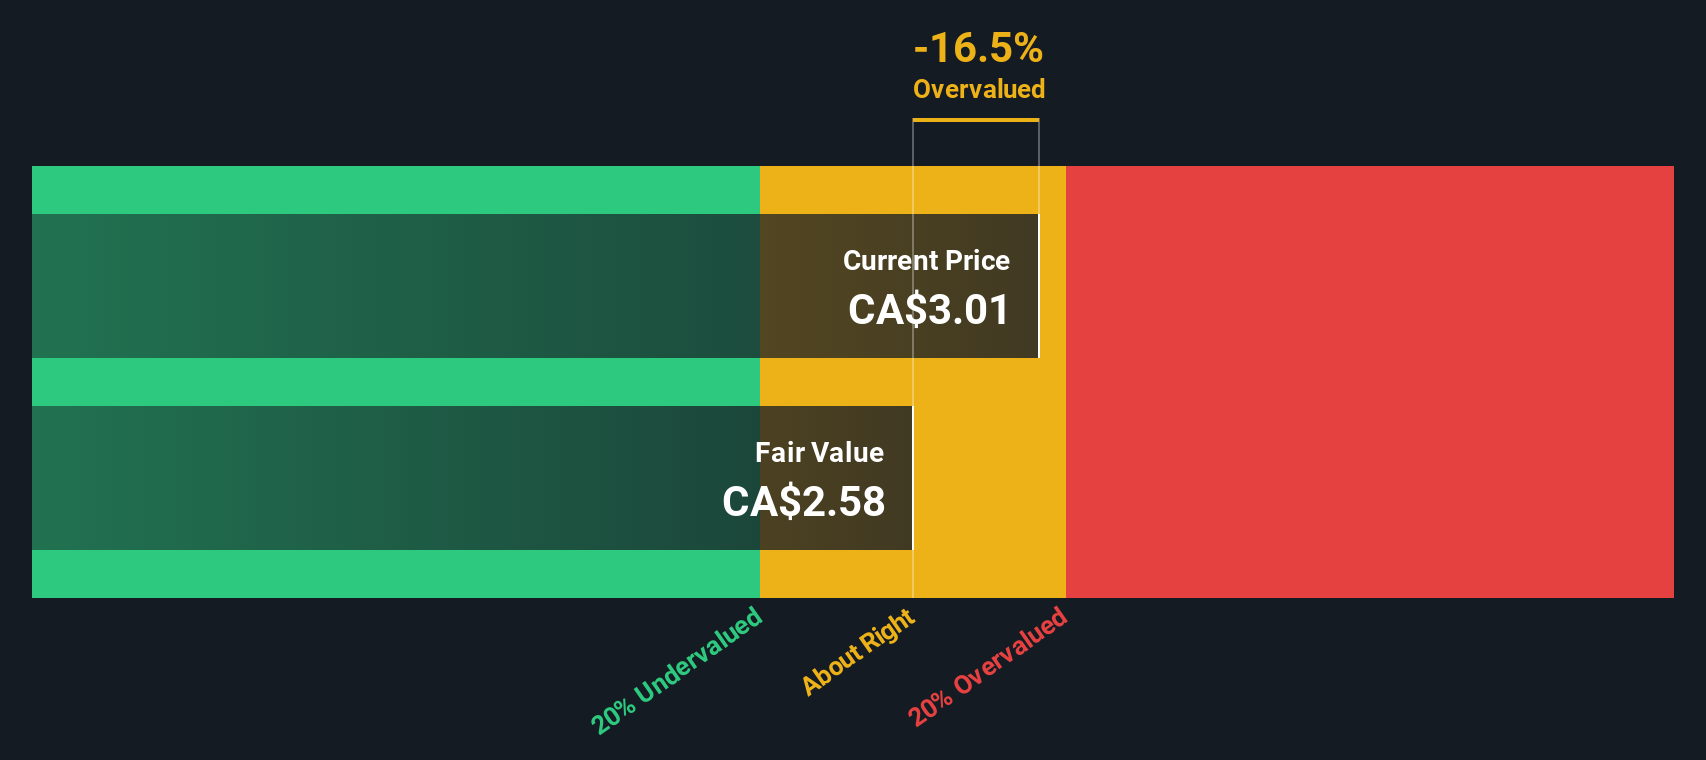
Putting these projections together, the DCF model suggests a fair value of about CA$13.88 per share. Compared with the current market price, this implies Baytex is roughly 67.5% undervalued, pointing to a wide gap between cash flow fundamentals and sentiment.
Result: UNDERVALUED
Our Discounted Cash Flow (DCF) analysis suggests Baytex Energy is undervalued by 67.5%. Track this in your watchlist or portfolio, or discover 908 more undervalued stocks based on cash flows.
Approach 2: Baytex Energy Price vs Earnings
For companies that are consistently profitable, the Price to Earnings, or PE, ratio is a useful yardstick because it anchors valuation to the actual profits each share generates today. Investors are essentially asking how many dollars they are willing to pay for one dollar of current earnings.
What counts as a normal or fair PE depends on how quickly earnings are expected to grow and how risky those earnings are. Faster, more reliable growth usually deserves a higher multiple, while cyclicality, leverage or earnings uncertainty tend to compress it.
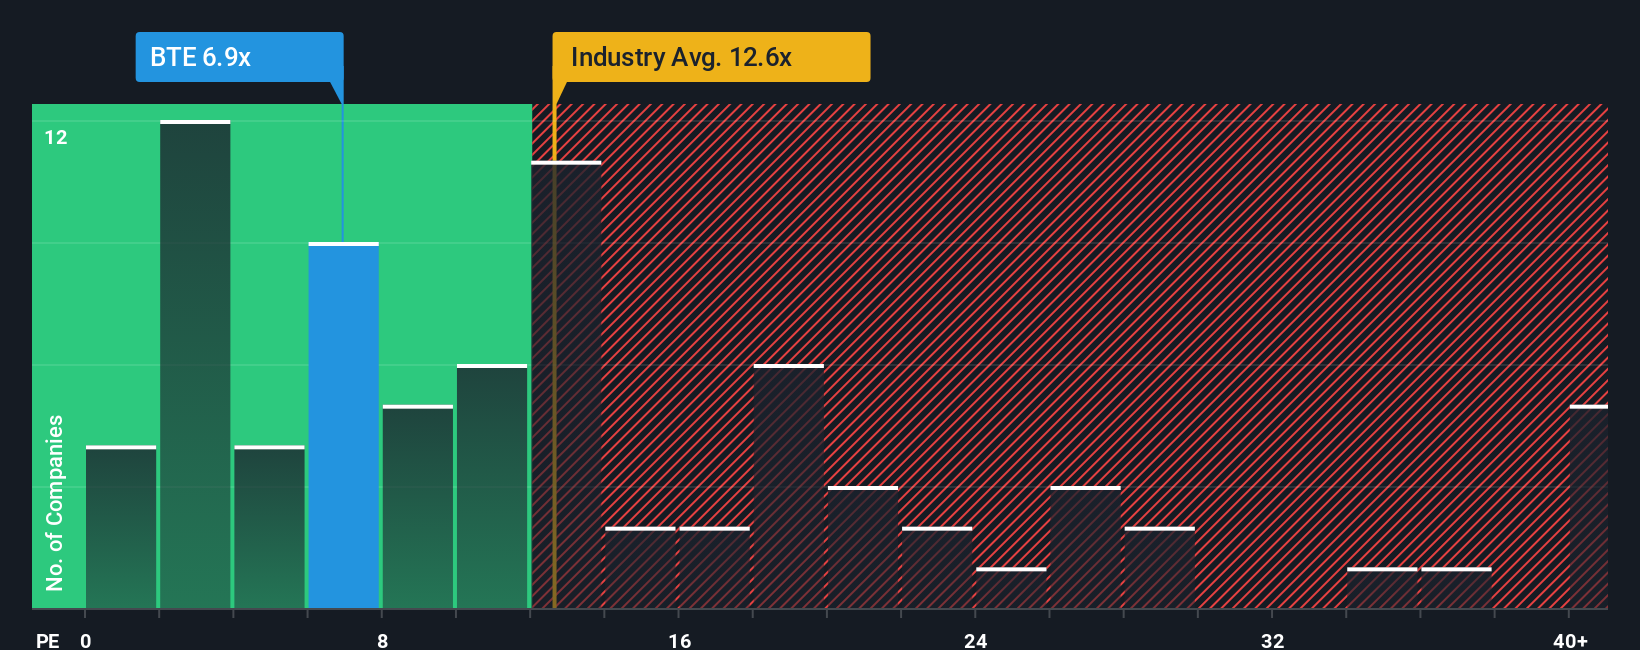
Baytex currently trades on a PE of about 16.1x, slightly above the Oil and Gas industry average of around 15.2x but well below the broader peer group average of roughly 27.9x. Simply Wall St’s proprietary Fair Ratio for Baytex is 6.10x, which reflects its specific mix of earnings growth prospects, profitability, industry, size and risk profile. This Fair Ratio is more tailored than a simple comparison with peers because it adjusts for the company’s own fundamentals rather than assuming all producers deserve the same multiple.
Set against that 6.10x Fair Ratio, Baytex’s current 16.1x PE suggests the shares are trading above what its risk adjusted earnings profile would typically justify.
Result: OVERVALUED
PE ratios tell one story, but what if the real opportunity lies elsewhere? Discover 1452 companies where insiders are betting big on explosive growth.
Upgrade Your Decision Making: Choose your Baytex Energy Narrative
Earlier we mentioned that there is an even better way to understand valuation, so let us introduce you to Narratives, a simple way to attach your story about Baytex Energy to the numbers by connecting your assumptions for future revenue, earnings and margins to a clear fair value estimate. A Narrative links what you believe will happen to the business to a financial forecast, and then to a fair value that you can easily compare with today’s share price to decide whether Baytex looks like a buy, a hold or a sell. On Simply Wall St, millions of investors can explore and create these Narratives on the Community page, where each one is kept up to date automatically as new information, such as earnings results or major news on asset sales and buybacks, comes in. For example, one Baytex Narrative on the platform currently sees fair value near CA$5.03 while a more cautious view sits closer to CA$2.50, showing how different stories and assumptions about oil prices, capital returns and Canadian growth can lead to very different, but clearly explained, valuations.
Do you think there's more to the story for Baytex Energy? Head over to our Community to see what others are saying!

This article by Simply Wall St is general in nature. We provide commentary based on historical data and analyst forecasts only using an unbiased methodology and our articles are not intended to be financial advice. It does not constitute a recommendation to buy or sell any stock, and does not take account of your objectives, or your financial situation. We aim to bring you long-term focused analysis driven by fundamental data. Note that our analysis may not factor in the latest price-sensitive company announcements or qualitative material. Simply Wall St has no position in any stocks mentioned.
Have feedback on this article? Concerned about the content? Get in touch with us directly. Alternatively, email editorial-team@simplywallst.com