
Does Darling Ingredients Recent Rebound Signal a Compelling 2025 Value Opportunity?
- Wondering if Darling Ingredients at around $36 a share is a bargain or a value trap? You are not alone, and this breakdown is for investors trying to make sense of where it really stands.
- After a rough few years, the stock has quietly clawed back with a 12.2% gain over the last month and a 6.4% rise year to date, even though it is still down 41.4% over 3 years.
- That rebound has come as investors refocus on Darling's role in renewable feedstocks and sustainable materials, especially its exposure to low carbon fuels and specialty ingredients. At the same time, shifting policy sentiment around renewables and evolving demand expectations have added a layer of uncertainty that is keeping some investors on the sidelines.
- Our Simply Wall St valuation checks currently give Darling Ingredients a 4/6 value score, suggesting the market may still be underestimating parts of the story. Next, we will walk through the main valuation approaches before finishing with a more holistic way to think about what the shares are really worth.
Approach 1: Darling Ingredients Discounted Cash Flow (DCF) Analysis
A Discounted Cash Flow, or DCF, model estimates what a business is worth by projecting its future cash flows and discounting them back to today in dollar terms. For Darling Ingredients, this analysis uses a 2 Stage Free Cash Flow to Equity approach that starts with current free cash flow and then tapers growth over time.
Darling generated about $383.4 million in free cash flow over the last twelve months, and analyst forecasts plus extrapolated estimates used in this model have this rising to around $590.6 million by 2035. The first few years of these projections rely on analyst estimates, while the later years are extended by Simply Wall St based on more modest, slowing growth assumptions.
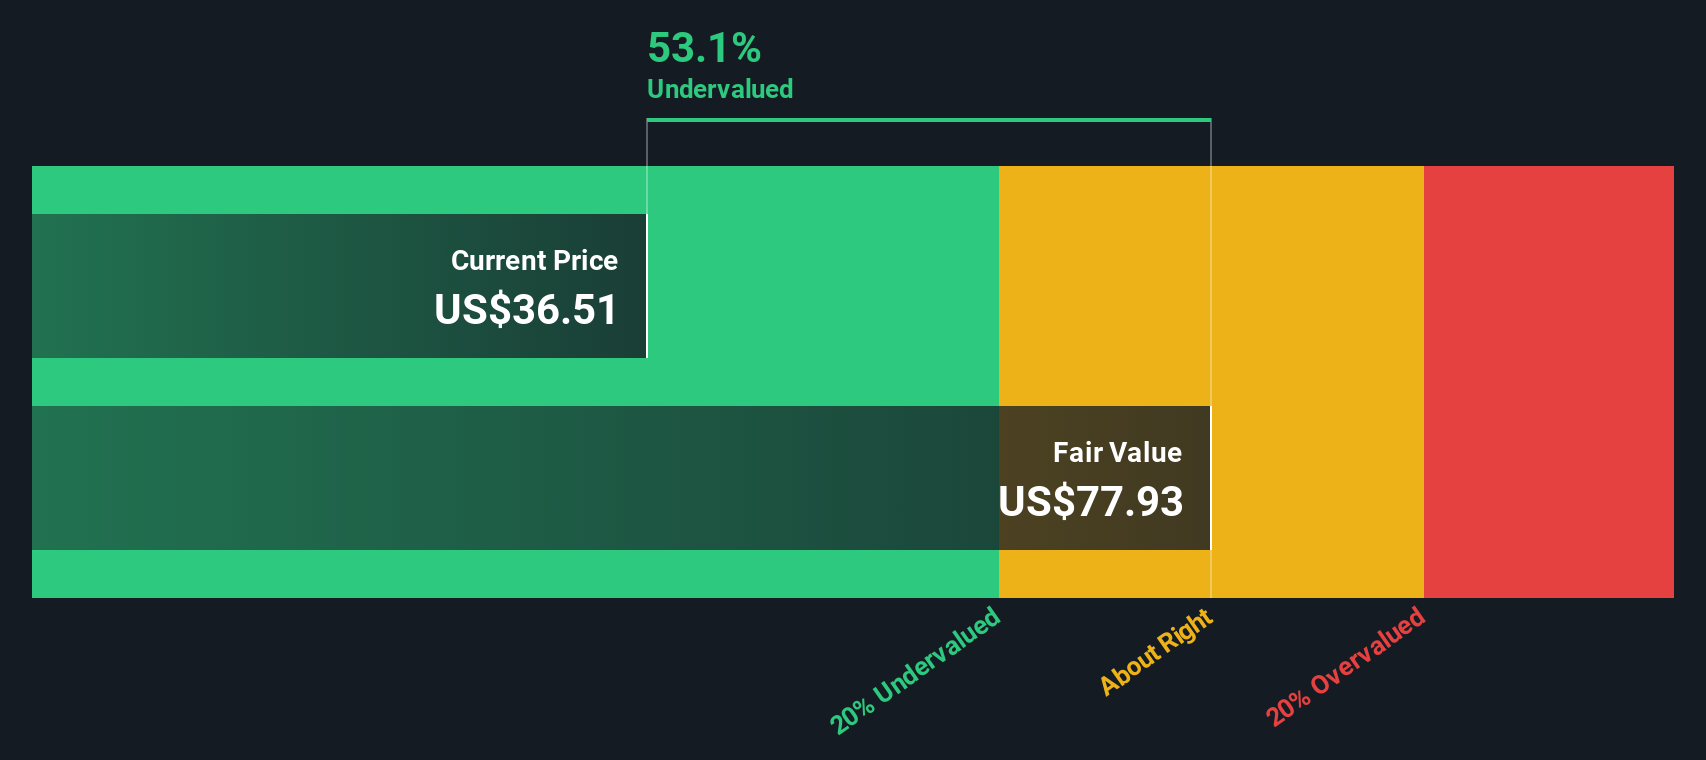
When those future cash flows are discounted back to today, the model points to an intrinsic value of roughly $77.93 per share. Compared with the recent share price of around $36, this DCF output implies the stock is about 53.1% undervalued according to the model, indicating the market price is well below the value suggested by these cash flow projections.
Result: UNDERVALUED (per this DCF model)
Our Discounted Cash Flow (DCF) analysis suggests Darling Ingredients is undervalued by 53.1%. Track this in your watchlist or portfolio, or discover 908 more undervalued stocks based on cash flows.
Approach 2: Darling Ingredients Price vs Earnings
For a profitable company like Darling Ingredients, the Price to Earnings (PE) ratio is a useful shorthand for how much investors are willing to pay today for each dollar of current earnings. In general, faster growth and lower perceived risk justify a higher PE, while slower growth or higher uncertainty usually mean a lower, more conservative multiple.
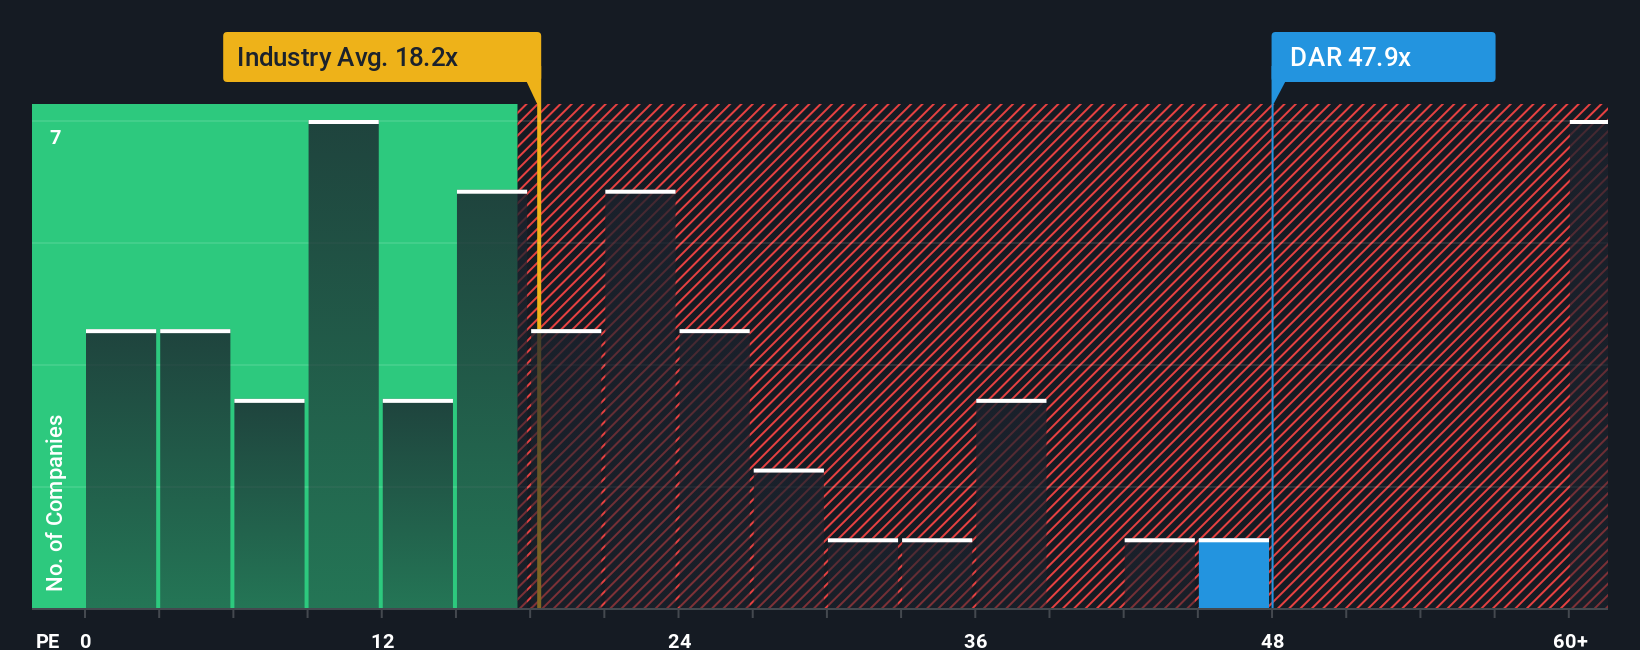
Darling currently trades on a PE of about 53.6x, which is well above both the Food industry average of roughly 20.3x and the broader peer group average of around 17.6x. On a simple comparison, that kind of premium might suggest the stock is expensive. However, Simply Wall St’s Fair Ratio framework estimates a PE of about 59.4x as more appropriate for Darling, after adjusting for its earnings growth outlook, profitability profile, industry positioning, market cap and risk factors.
Because the Fair Ratio is tailored to Darling’s specific fundamentals, it provides a more nuanced reference point than raw peer or industry comparisons. With the current PE of 53.6x sitting below the Fair Ratio of 59.4x, the multiple suggests the market is still pricing Darling’s earnings at a discount to what its fundamentals would justify.
Result: UNDERVALUED
PE ratios tell one story, but what if the real opportunity lies elsewhere? Discover 1452 companies where insiders are betting big on explosive growth.
Upgrade Your Decision Making: Choose your Darling Ingredients Narrative
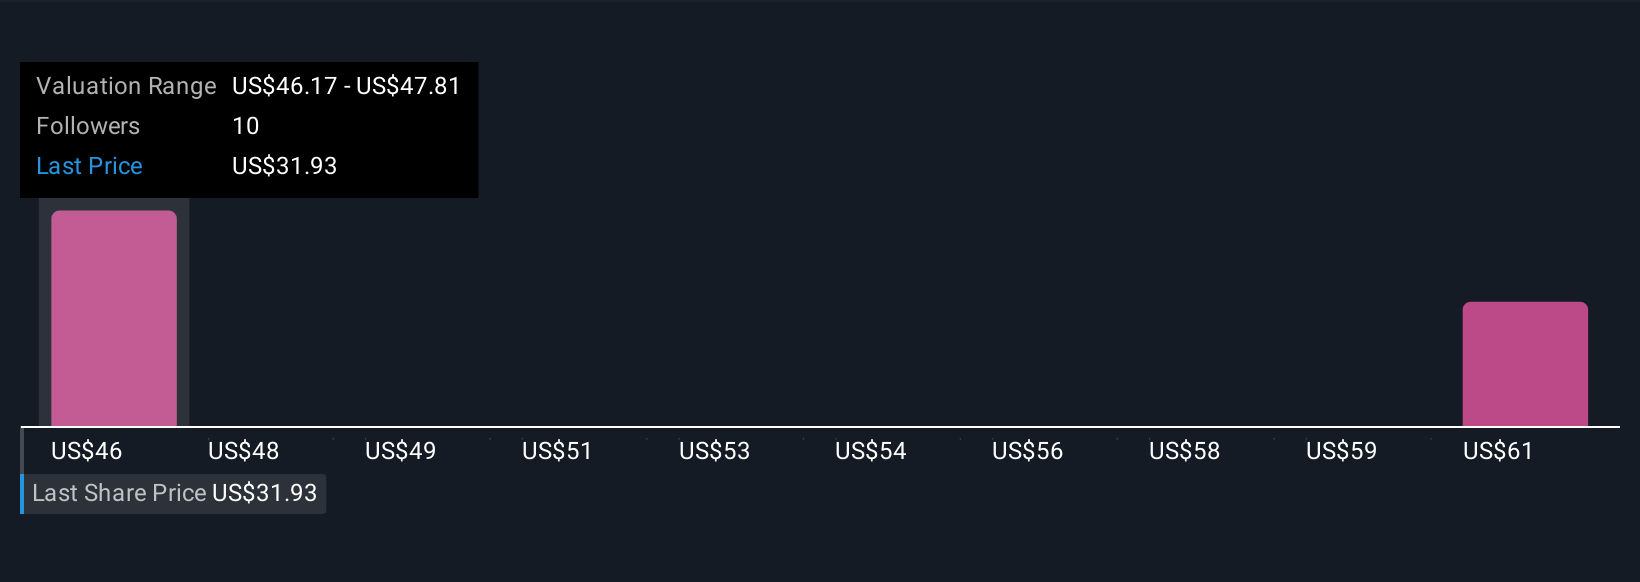
Earlier we mentioned that there is an even better way to understand valuation, so let us introduce you to Narratives, which are simply your story about a company, tied to your assumptions for its future revenue, earnings, margins and fair value. A Narrative on Simply Wall St, available to millions of investors via the Community page, links what you believe about a company’s business drivers to a concrete financial forecast and then to a Fair Value estimate you can directly compare with today’s share price to help inform whether to buy, hold or sell. Narratives stay live and dynamic, updating automatically as new information such as earnings results, policy decisions or major news flows in. This helps reduce the risk that your view goes stale. For Darling Ingredients, for example, one investor Narrative might assume that favorable biofuel policies stick, margins climb toward 10 percent and the fair value is closer to $60. A more cautious Narrative could instead emphasize potential regulatory setbacks, slower specialty ingredient uptake and a fair value around $34. The platform lets you see and test both perspectives against your own expectations.
Do you think there's more to the story for Darling Ingredients? Head over to our Community to see what others are saying!
This article by Simply Wall St is general in nature. We provide commentary based on historical data and analyst forecasts only using an unbiased methodology and our articles are not intended to be financial advice. It does not constitute a recommendation to buy or sell any stock, and does not take account of your objectives, or your financial situation. We aim to bring you long-term focused analysis driven by fundamental data. Note that our analysis may not factor in the latest price-sensitive company announcements or qualitative material. Simply Wall St has no position in any stocks mentioned.
Have feedback on this article? Concerned about the content? Get in touch with us directly. Alternatively, email editorial-team@simplywallst.com