
Is It Too Late To Consider AMD After Its 80.7% 2025 Surge?
- Wondering if Advanced Micro Devices at around $217 a share is still a smart buy or if most of the upside is already priced in? You are not alone. This stock is on a lot of watchlists right now.
- Despite a recent 6.7% pullback over the last month, AMD is still up 80.7% year to date and 217.8% over three years, which shows how powerful the long-term story has been.
- Much of that move has been driven by excitement around AMD's expanding role in high performance computing and AI infrastructure, from data center chips that compete directly with Nvidia to partnerships with major cloud providers. At the same time, growing attention on semiconductor supply chains and AI spending cycles has made the stock more sensitive to headlines, adding both opportunity and risk.
- Right now AMD scores a 3 out of 6 on our valuation checks, suggesting it looks undervalued on some measures but not across the board. In the sections that follow, we walk through those different approaches and then finish with a more holistic way to think about what AMD may be worth.
Approach 1: Advanced Micro Devices Discounted Cash Flow (DCF) Analysis
A Discounted Cash Flow model estimates what a company is worth by projecting the cash it can generate in the future and discounting those cash flows back to today. For Advanced Micro Devices, the model starts with last twelve months free cash flow of about $5.6 billion, then layers on analyst forecasts and longer term growth assumptions.
Analysts currently expect free cash flow to rise from around $7.1 billion in 2026 to roughly $31 billion by 2029. Beyond those years, Simply Wall St extrapolates the trend, with projections reaching about $74.9 billion in 2035. All of these future cash flows are discounted back using a required rate of return. This produces an estimated intrinsic value of roughly $376 per share.
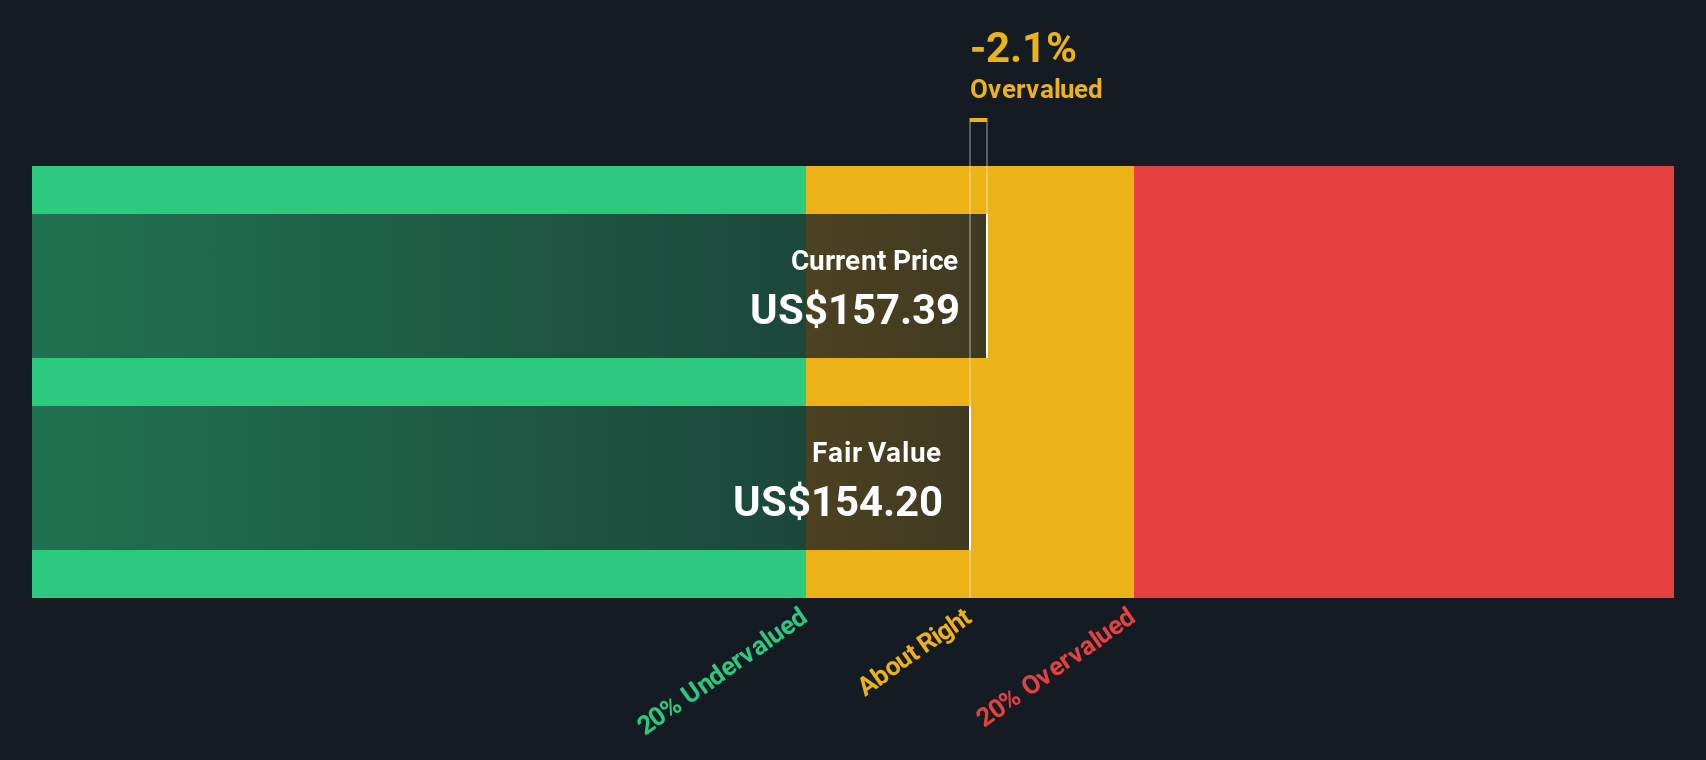
Compared with the recent share price around $217, the DCF suggests AMD is trading at about a 42.1% discount to its calculated fair value. This implies meaningful upside if these cash flow expectations are met.
Result: UNDERVALUED
Our Discounted Cash Flow (DCF) analysis suggests Advanced Micro Devices is undervalued by 42.1%. Track this in your watchlist or portfolio, or discover 908 more undervalued stocks based on cash flows.
Approach 2: Advanced Micro Devices Price vs Earnings
For profitable companies like Advanced Micro Devices, the price to earnings ratio is a useful way to gauge how much investors are willing to pay today for each dollar of current earnings. What counts as a reasonable PE depends on how quickly earnings are expected to grow and how risky or cyclical those earnings might be.
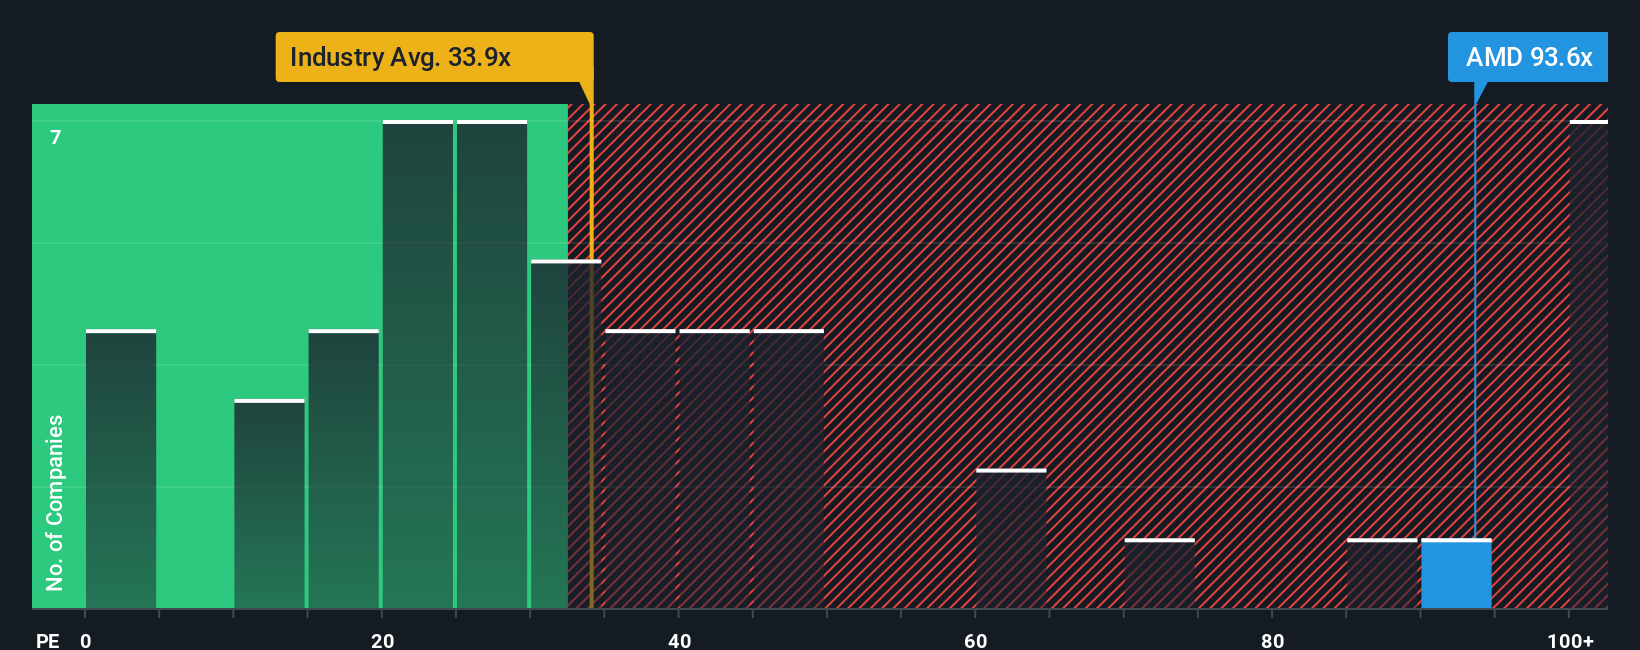
AMD currently trades on a PE of about 113.3x, which is well above both the broader semiconductor industry average of roughly 38.0x and the peer group average of around 69.6x. At first glance, that premium suggests that very high growth is already reflected in the price. To refine that view, Simply Wall St uses a proprietary Fair Ratio, which estimates what AMD’s PE should be after accounting for factors like its earnings growth outlook, profit margins, industry, market cap and risk profile.
For AMD, this Fair Ratio comes out at about 64.2x, which is meaningfully below the current 113.3x. That gap indicates the market is paying far more than what these fundamentals would typically justify, even allowing for strong growth and quality.
Result: OVERVALUED
PE ratios tell one story, but what if the real opportunity lies elsewhere? Discover 1452 companies where insiders are betting big on explosive growth.
Upgrade Your Decision Making: Choose your Advanced Micro Devices Narrative
Earlier we mentioned that there is an even better way to understand valuation. Let us introduce you to Narratives, an easy tool on Simply Wall St’s Community page where you connect your story about a company to a set of numbers by stating what you think AMD’s future revenue, earnings and margins will look like. This turns that view into a fair value, which you can then compare with the current price to see whether it looks like a buy or a sell for you. Everything updates dynamically as new news or earnings arrive. One investor might build a bullish AMD Narrative with a fair value closer to $291 per share, while another, more cautious investor might anchor on a fair value nearer $137. Both can clearly see how their different views on growth, risk and profitability lead to very different estimates of what the stock is really worth.
For Advanced Micro Devices, however, we will make it really easy for you with previews of two leading Advanced Micro Devices Narratives:
🐂 Advanced Micro Devices Bull Case
Fair value: $283.57 per share
Discount to fair value: 23.2%
Revenue growth assumption: 34.7%
- Analyst consensus expects multiyear AI and data center deals, including sovereign and hyperscale projects, to support strong top line growth and margin expansion.
- Fair value around $284 per share reflects confidence that AMD can sustain high-30% style revenue growth and expand net margins above 20% while still trading on a premium but compressing PE multiple.
- This narrative leans on AMD cementing its role as a leading AI infrastructure provider despite competition, with MI300 and follow-on accelerators driving long-term earnings power.
🐻 Advanced Micro Devices Bear Case
Fair value: $193.68 per share
Premium to fair value: 12.5%
Revenue growth assumption: 18.8%
- Highlights execution and competitive risks in AI GPUs and data centers, with Nvidia, Intel and ARM-based designs potentially limiting AMD's share gains and pricing power.
- Emphasizes cyclical, macroeconomic and geopolitical headwinds, including reliance on TSMC, export controls and softer PC or gaming demand, that could cap growth and compress margins.
- Suggests AMD is a promising but high-risk growth story where current pricing bakes in optimistic AI and data center outcomes, so more cautious investors may prefer to wait for clearer execution or better entry points.
Do you think there's more to the story for Advanced Micro Devices? Head over to our Community to see what others are saying!
This article by Simply Wall St is general in nature. We provide commentary based on historical data and analyst forecasts only using an unbiased methodology and our articles are not intended to be financial advice. It does not constitute a recommendation to buy or sell any stock, and does not take account of your objectives, or your financial situation. We aim to bring you long-term focused analysis driven by fundamental data. Note that our analysis may not factor in the latest price-sensitive company announcements or qualitative material. Simply Wall St has no position in any stocks mentioned.
Have feedback on this article? Concerned about the content? Get in touch with us directly. Alternatively, email editorial-team@simplywallst.com