
Is Amazon Still Attractive After AI Expansion and Recent Share Price Pullback?
- If you have ever wondered whether Amazon.com at $229.53 is still a smart buy or if most of the upside is already priced in, you are exactly who this breakdown is for.
- The stock has dipped about 1.6% over the past week and 6.1% over the last month, but it is still up 4.2% year to date and a massive 157.6% over three years. This tells a very different story from the modest 1.1% gain over the past year.
- Recent headlines have focused on Amazon's push to deepen its AI capabilities across AWS and retail, expansion of its advertising business, and continued investment in logistics to speed up deliveries. Taken together, these moves are reshaping how investors think about its long term growth engine and risk profile beyond the short term share price noise.
- Right now, Amazon.com scores a 5 out of 6 on our valuation checks. You can dig into this in detail via our valuation score. Next we will unpack the main valuation approaches behind that number, before finishing with a more powerful way to understand what Amazon might really be worth.
Find out why Amazon.com's 1.1% return over the last year is lagging behind its peers.
Approach 1: Amazon.com Discounted Cash Flow (DCF) Analysis
A Discounted Cash Flow model estimates what a company is worth by projecting the cash it can generate in the future and discounting those cash flows back to today in dollar terms. For Amazon.com, the 2 Stage Free Cash Flow to Equity model starts with last twelve month free cash flow of roughly $40.0 billion and then applies analyst forecasts and longer term assumptions about growth.
Analysts project free cash flow to climb sharply over the next decade, with Simply Wall St extrapolating those forecasts to around $263.9 billion by 2035. Each future year of cash flow is discounted back to its value in today’s dollars, then summed to arrive at an intrinsic value per share.
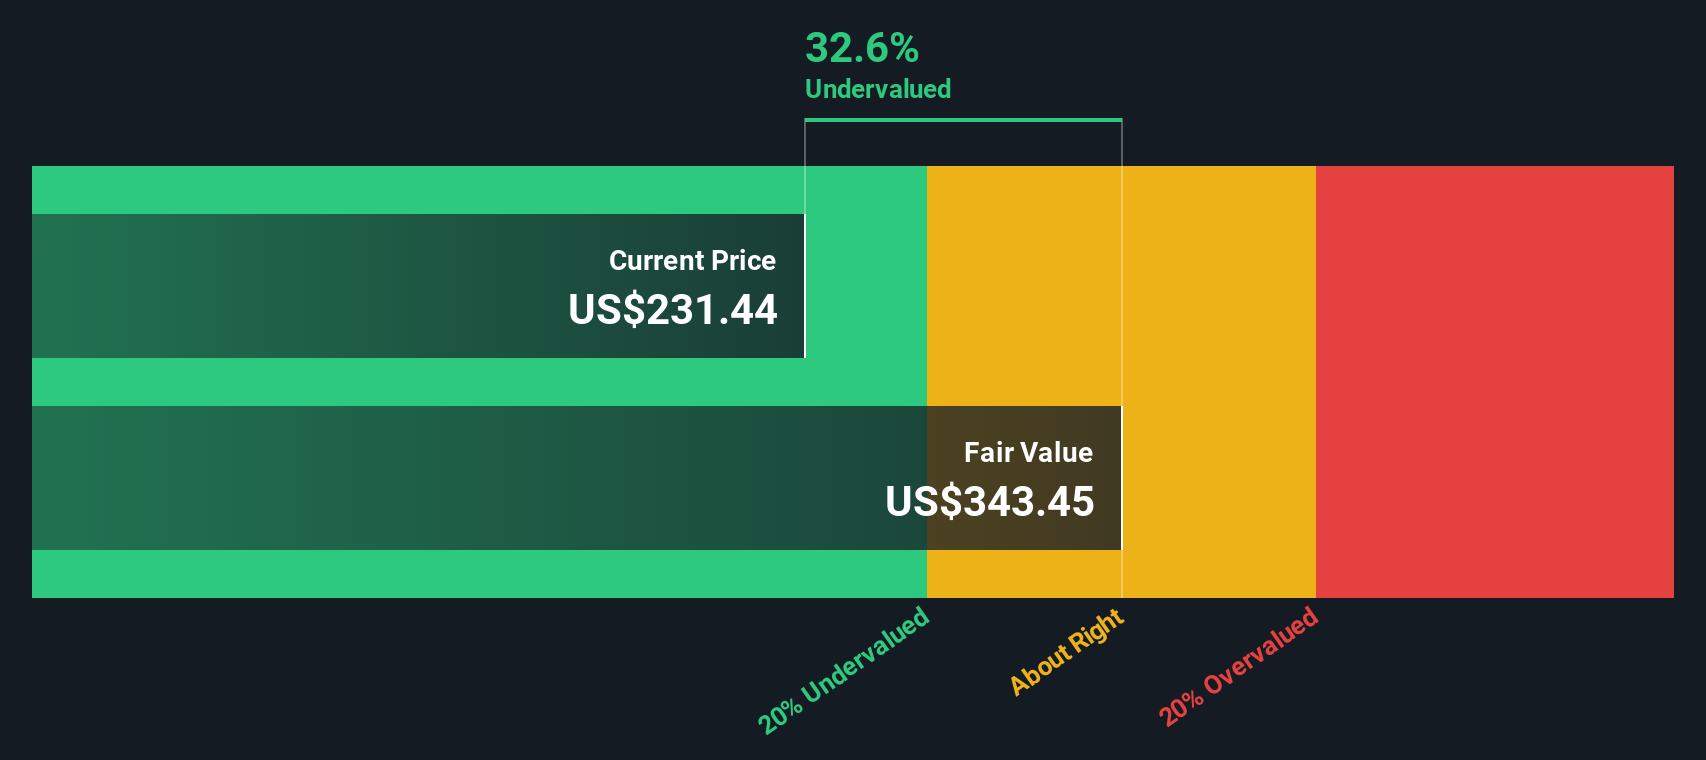
On this basis, the model estimates a fair value of about $304.65 per share, implying Amazon.com is trading at a 24.7% discount to its intrinsic value relative to the current price around $229.53. That suggests the market is not fully pricing in the company’s long term cash generation potential.
Result: UNDERVALUED
Our Discounted Cash Flow (DCF) analysis suggests Amazon.com is undervalued by 24.7%. Track this in your watchlist or portfolio, or discover 908 more undervalued stocks based on cash flows.
Approach 2: Amazon.com Price vs Earnings
For profitable companies like Amazon.com, the price to earnings, or PE, ratio is a useful way to gauge how much investors are willing to pay today for each dollar of current profits. The higher the expected growth and the lower the perceived risk, the more investors are usually prepared to pay, which pushes a normal or fair PE ratio higher, while slower growth or higher risk justify a lower multiple.
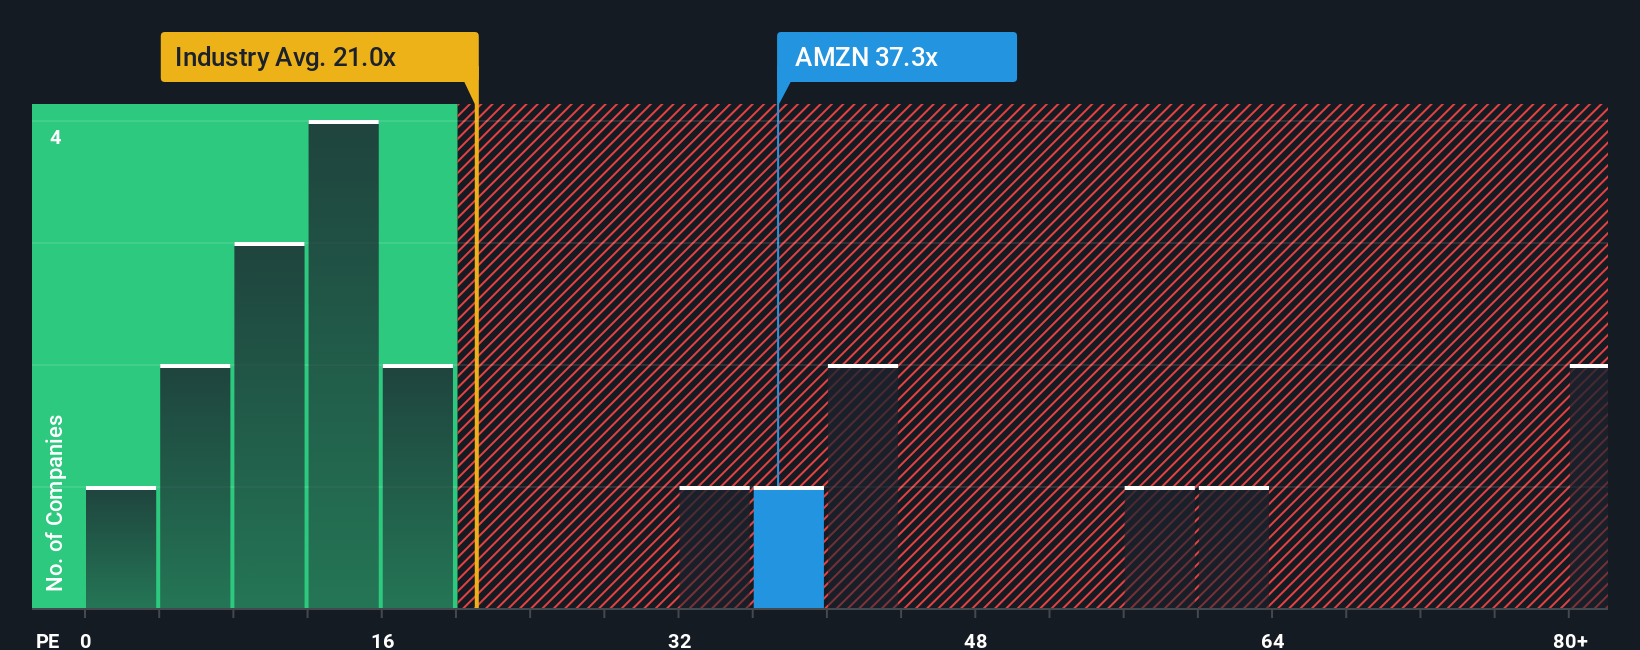
Amazon currently trades on a PE of about 32.1x, which is well above the Multiline Retail industry average of roughly 19.8x but below the average of its closer growth oriented peers at around 34.5x. To move beyond these blunt comparisons, Simply Wall St uses a proprietary Fair Ratio, which estimates what Amazon's PE should be given its earnings growth outlook, industry, profit margins, market cap and risk profile. For Amazon, that Fair Ratio is 40.2x.
Because the Fair Ratio is tailored to Amazon's specific fundamentals, it can be more informative than simple peer or sector averages. Comparing 32.1x to the 40.2x Fair Ratio suggests the shares are trading below where they arguably should be based on those drivers.
Result: UNDERVALUED
PE ratios tell one story, but what if the real opportunity lies elsewhere? Discover 1452 companies where insiders are betting big on explosive growth.
Upgrade Your Decision Making: Choose your Amazon.com Narrative
Earlier we mentioned that there is an even better way to understand valuation. On Simply Wall St that starts with Narratives, where you attach your own story about a company, including assumptions for future revenue, earnings, margins and a fair value, to a structured forecast that can be compared with the current price.
In practice, a Narrative acts as a bridge, linking what you believe about Amazon's business, such as AWS and advertising driving margins higher or retail growth slowing, to a quantified outlook and then to a fair value per share. This allows you to see whether your story actually supports buying, holding or selling.
These Narratives live inside the Simply Wall St Community page. They are easy to set up and refine, and automatically update as new data, like earnings or major news, comes in. This means your fair value estimate and buy or sell signal can adjust in real time instead of being a static one off calculation.
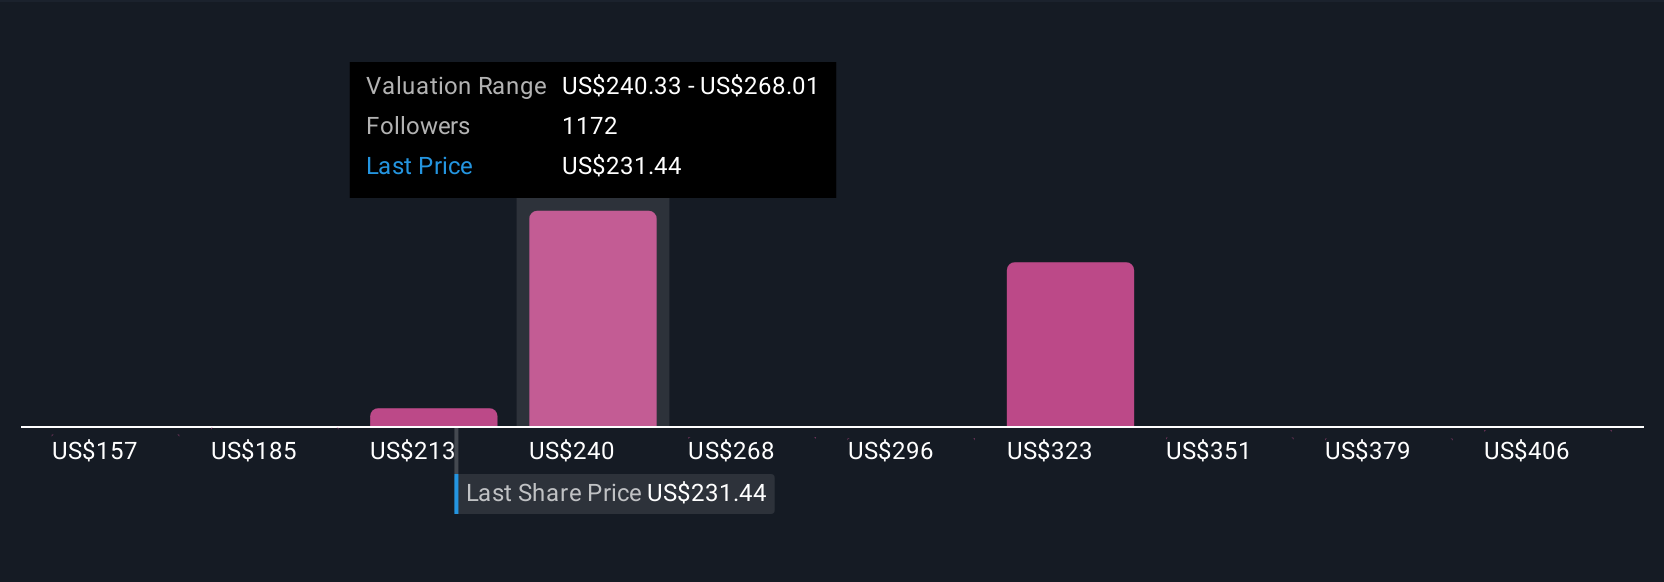
For example, one Amazon Narrative might assume a fair value near $217.95 with more cautious growth and margins, while another could land closer to $294.65 based on stronger cloud and AI momentum. This gives different investors clear, data backed pathways to act on their own convictions.
For Amazon.com however we will make it really easy for you with previews of two leading Amazon.com Narratives:
Fair value: $234.75
Implied undervaluation vs current price: 2.2%
Revenue growth assumption: 13.6%
- Views the recent share price pullback after 2Q25 as an opportunity, with Amazon's core e commerce, AWS and advertising businesses all seen as structurally strong.
- Highlights a long list of growth initiatives, especially in AI and cloud infrastructure, plus Kuiper and logistics innovation, that could add upside not fully captured in current forecasts.
- Projects a 10 year upside scenario above $670. The analyst argues that their own valuation and return assumptions are likely conservative given the breadth of Amazon's pipeline.
Fair value: $222.55
Implied overvaluation vs current price: 3.1%
Revenue growth assumption: 15.19%
- Agrees that Amazon's true earnings power is higher than reported, driven by 3P sellers, AWS and advertising, but argues the market is already pricing in much of this long term potential.
- Assumes robust growth across key segments, yet expects heavy, ongoing reinvestment to keep free cash flow suppressed for years as management prioritizes scale and competitive advantage.
- Sees regulatory scrutiny and macro slowdowns as meaningful risks to the growth trajectory. This leads to a view that, around today's price, Amazon looks closer to fairly valued or slightly expensive than a clear bargain.
Do you think there's more to the story for Amazon.com? Head over to our Community to see what others are saying!
This article by Simply Wall St is general in nature. We provide commentary based on historical data and analyst forecasts only using an unbiased methodology and our articles are not intended to be financial advice. It does not constitute a recommendation to buy or sell any stock, and does not take account of your objectives, or your financial situation. We aim to bring you long-term focused analysis driven by fundamental data. Note that our analysis may not factor in the latest price-sensitive company announcements or qualitative material. Simply Wall St has no position in any stocks mentioned.
Have feedback on this article? Concerned about the content? Get in touch with us directly. Alternatively, email editorial-team@simplywallst.com