
Revisiting FirstEnergy’s (FE) Valuation After a Recent Pullback and Strong Multi‑Year Shareholder Returns
FirstEnergy (FE) has quietly outperformed many defensive peers over the past year, and with the stock pulling back about 6% this week, investors are revisiting whether the current price still offers upside.
See our latest analysis for FirstEnergy.
That recent 7 day share price pullback sits against a solid 12.5% year to date share price return and an 81.8% five year total shareholder return, suggesting long term momentum is still very much intact even as near term sentiment cools.
If FirstEnergy’s move has you rethinking your income and stability mix, it could be worth exploring healthcare stocks as another place to uncover durable, defensive stories with different growth drivers.
With earnings still growing, a modest pullback, and analysts seeing double digit upside from here, the big question now is whether FirstEnergy is quietly undervalued or if the market is already pricing in its future growth.
Most Popular Narrative Narrative: 10% Undervalued
Compared to FirstEnergy’s last close at $44.91, the most widely followed narrative sees fair value closer to $49.92, implying the recent dip has not fully erased the upside.
Large scale infrastructure modernization and grid hardening initiatives, including the $28 billion investment plan through 2029 and a 15% CAGR in transmission rate base, enable higher returns on equity, improved reliability, and ultimately enhance net margins and earnings growth.
Curious how steady, utility style growth can still justify a richer future earnings multiple and margin lift, even with modest revenue forecasts? The narrative leans on a tight set of assumptions around cash generation, capital intensity, and a carefully stepped up profit profile that could surprise long term holders. Want to see exactly how those moving parts stack up into that fair value call?
Result: Fair Value of $49.92 (UNDERVALUED)
Have a read of the narrative in full and understand what's behind the forecasts.
However, faster than expected distributed energy adoption or greater than planned capital needs could pressure cash flows and force dilutive funding, challenging that upside case.
Find out about the key risks to this FirstEnergy narrative.
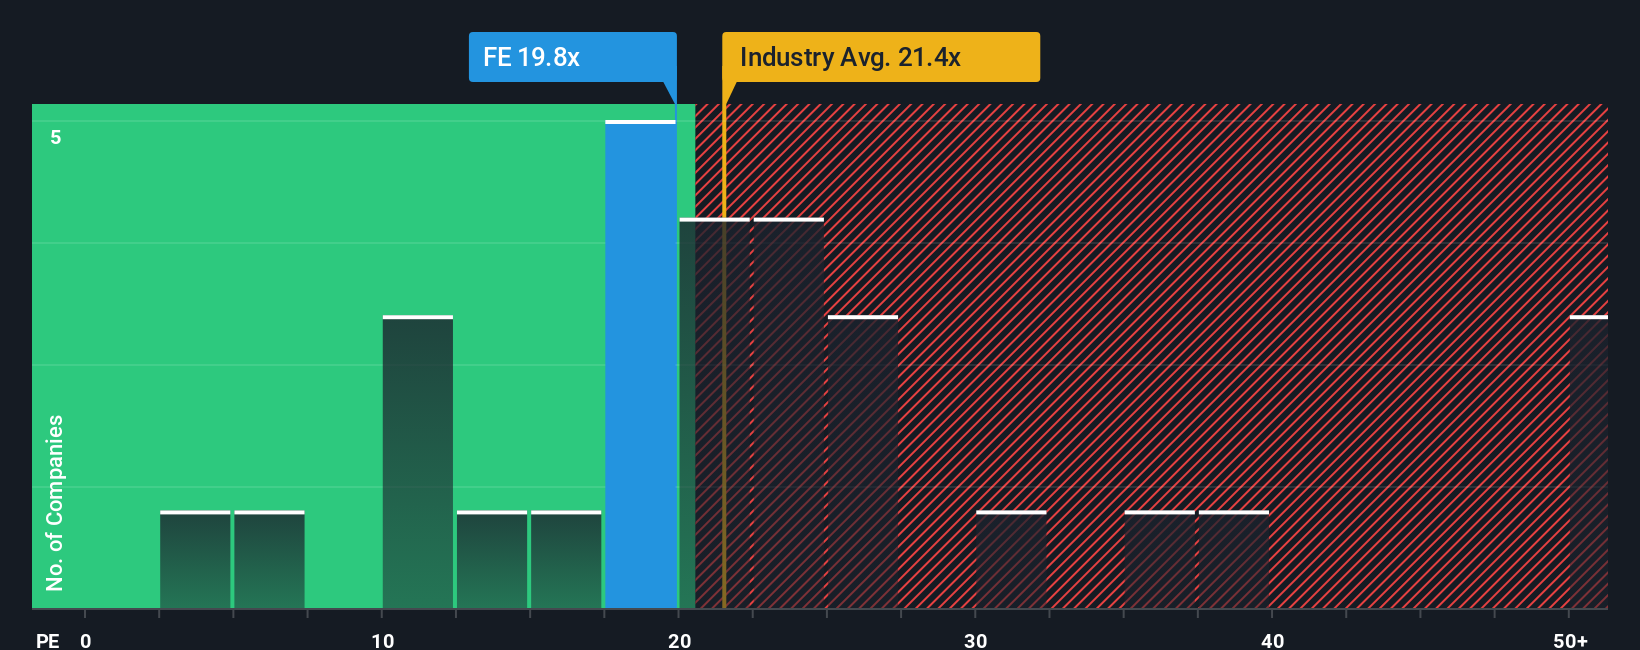
Another Angle: Market Multiple Signals Caution
Our SWS DCF model may flag upside, but the price tag tells a different story. At 19.5x earnings, FirstEnergy trades richer than its 15.5x peer average yet remains below a 23.5x fair ratio. Is the market rightly cautious, or leaving some value on the table?
See what the numbers say about this price — find out in our valuation breakdown.
Build Your Own FirstEnergy Narrative
If this storyline does not fully match your own view, or you would rather interrogate the numbers yourself, you can build a tailored narrative in minutes with Do it your way.
A great starting point for your FirstEnergy research is our analysis highlighting 3 key rewards and 2 important warning signs that could impact your investment decision.
Looking for more investment ideas?
Before you move on, lock in a broader watchlist of opportunities with the Simply Wall St Screener so you are not leaving potential returns on the table.
- Capture high-upside potential in overlooked companies by scanning these 3575 penny stocks with strong financials that already back their promise with solid financial foundations.
- Ride powerful structural trends by targeting these 30 healthcare AI stocks that blend medical breakthroughs with scalable AI driven business models.
- Strengthen your income stream by zeroing in on these 15 dividend stocks with yields > 3% that aim to balance yield with sustainable payout ratios and resilient cash flows.
This article by Simply Wall St is general in nature. We provide commentary based on historical data and analyst forecasts only using an unbiased methodology and our articles are not intended to be financial advice. It does not constitute a recommendation to buy or sell any stock, and does not take account of your objectives, or your financial situation. We aim to bring you long-term focused analysis driven by fundamental data. Note that our analysis may not factor in the latest price-sensitive company announcements or qualitative material. Simply Wall St has no position in any stocks mentioned.
Have feedback on this article? Concerned about the content? Get in touch with us directly. Alternatively, email editorial-team@simplywallst.com