
Assessing Avidity Biosciences (RNA) Valuation After Its Strong Multi‑Year Share Price Rally
Avidity Biosciences (RNA) has quietly turned into a strong performer, with the stock up sharply this year as investors warm to its RNA therapeutic platform and advancing muscular dystrophy pipeline.
See our latest analysis for Avidity Biosciences.
That surge in optimism is showing up in the numbers, with a roughly 49 percent 3 month share price return feeding into a powerful 129 percent year to date share price gain and an eye catching 3 year total shareholder return above 550 percent. This suggests momentum is still very much on Avidity Biosciences' side as its AOC programs progress.
If Avidity's run has you rethinking where the next big biotech story could come from, this is a good moment to explore other promising healthcare stocks on Simply Wall St.
Yet with shares now hovering just below analyst targets and trading after a huge multi year rerating, investors must ask: is there still upside left in Avidity, or is the market already pricing in all that future growth?
Price to Book Ratio of 5.7x: Is It Justified?
Avidity Biosciences last closed at $71.63, and its price to book ratio of 5.7 times points to a market that is already paying up for the story relative to the broader US biotech space.
The price to book ratio compares a company’s market value to its net assets on the balance sheet. This measure is especially relevant for early stage biotechs that are still loss making and are valued more on their platforms and pipelines than on current earnings. For Avidity, a premium multiple suggests investors are ascribing significant value to its AOC technology and late stage muscular dystrophy programs despite ongoing losses.
While Avidity screens as expensive versus the wider US biotechs industry average of 2.7 times book, it sits at a discount to a closer peer group average of 8.4 times. This underscores that sentiment is positive but not euphoric compared to higher flying comparables.
See what the numbers say about this price — find out in our valuation breakdown.
Result: Price to Book ratio of 5.7x (OVERVALUED)
However, setbacks in late stage trials or slower than expected adoption of its AOC platform could quickly undermine the premium valuation that investors now assign.
Find out about the key risks to this Avidity Biosciences narrative.
Another Lens, Same Caution
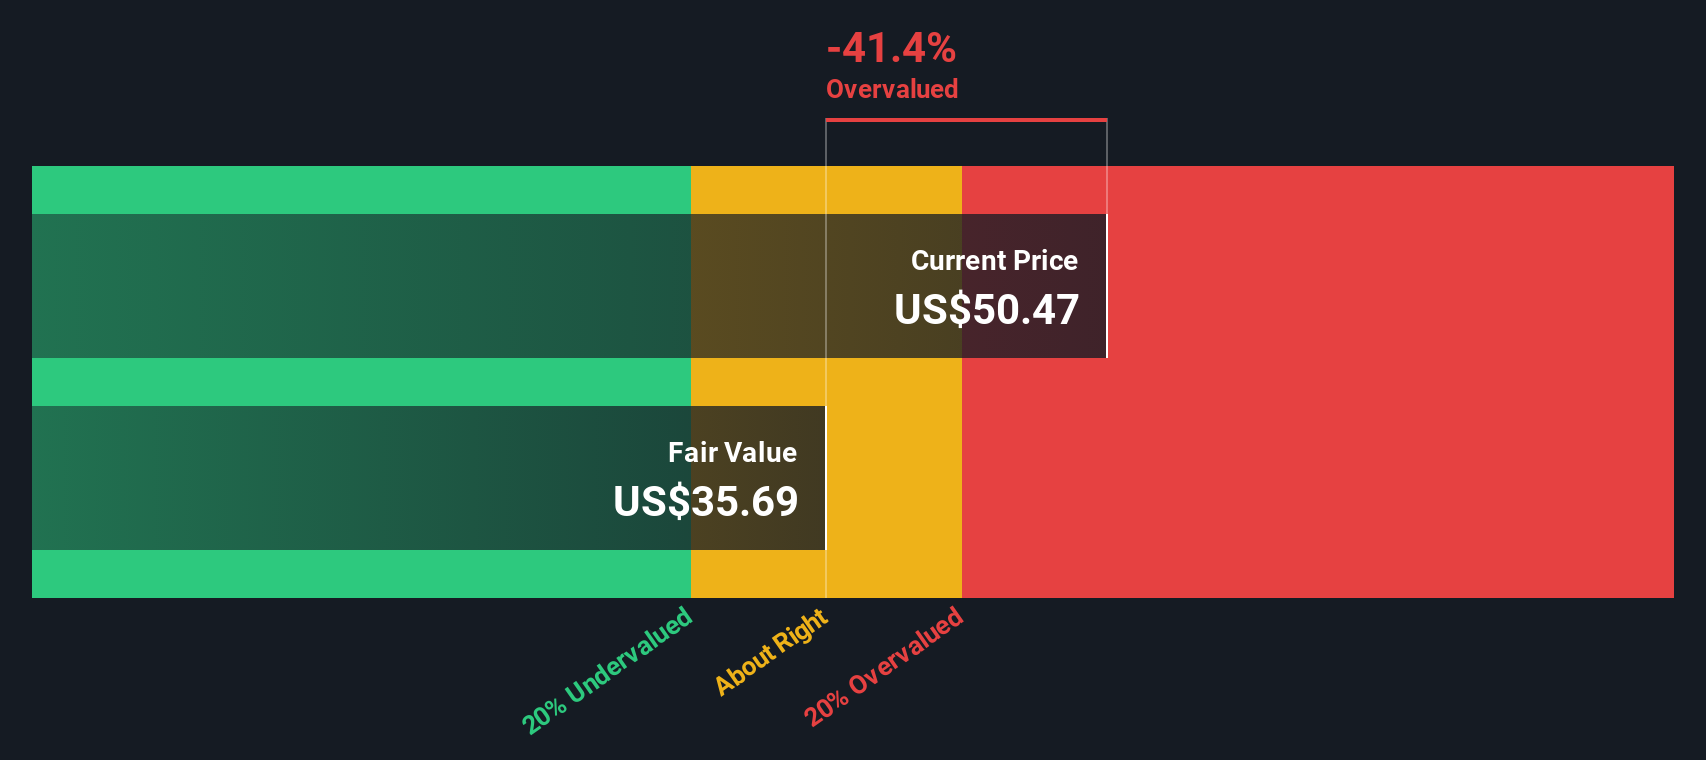
Our DCF model tells a starker story than the 5.7 times book ratio. On that framework, Avidity trades well above an estimated fair value of about $30 per share, which suggests the stock may be materially overvalued if future cash flows fall short of current expectations.
Look into how the SWS DCF model arrives at its fair value.
Simply Wall St performs a discounted cash flow (DCF) on every stock in the world every day (check out Avidity Biosciences for example). We show the entire calculation in full. You can track the result in your watchlist or portfolio and be alerted when this changes, or use our stock screener to discover 908 undervalued stocks based on their cash flows. If you save a screener we even alert you when new companies match - so you never miss a potential opportunity.
Build Your Own Avidity Biosciences Narrative
If you see the data differently or simply prefer your own due diligence, you can build a personalized view in just a few minutes: Do it your way.
A great starting point for your Avidity Biosciences research is our analysis highlighting 1 key reward and 3 important warning signs that could impact your investment decision.
Looking for more investment ideas?
Before you move on, consider your next move by scanning other opportunities on Simply Wall St, where focused screeners can reveal what the market is still missing.
- Explore early stage opportunities with these 3575 penny stocks with strong financials that already show solid underlying numbers.
- Filter for innovation leaders among these 26 AI penny stocks to gain exposure to the AI theme.
- Review these 908 undervalued stocks based on cash flows that the market has not fully appreciated yet.
This article by Simply Wall St is general in nature. We provide commentary based on historical data and analyst forecasts only using an unbiased methodology and our articles are not intended to be financial advice. It does not constitute a recommendation to buy or sell any stock, and does not take account of your objectives, or your financial situation. We aim to bring you long-term focused analysis driven by fundamental data. Note that our analysis may not factor in the latest price-sensitive company announcements or qualitative material. Simply Wall St has no position in any stocks mentioned.
Have feedback on this article? Concerned about the content? Get in touch with us directly. Alternatively, email editorial-team@simplywallst.com