
Is There an Opportunity in Kenvue After a 20% Slide and DCF Upside?
- If you have been wondering whether Kenvue is a beaten down bargain or a value trap at around $16.93, you are not alone. This article is going to walk through the numbers with you.
- Despite a modest 0.3% move over the last month, the stock is still down 2.4% in the past week and roughly 20.4% year to date, leaving it about 22.8% lower than it was a year ago and squarely on value investors radar.
- Those swings have played out against a backdrop of Kenvue continuing to carve out its identity as a standalone consumer health company after separating from Johnson & Johnson. Investors have been digesting updates around its brand portfolio, debt profile, and how management plans to balance growth investments with returning cash to shareholders.
- On our valuation framework, Kenvue scores a 4 out of 6 for being undervalued across key checks, which suggests there is real, but not flawless, value on the table. Next we will break down what that means under different valuation approaches, before finishing with a more holistic way to judge whether the market is getting Kenvue wrong.
Find out why Kenvue's -22.8% return over the last year is lagging behind its peers.
Approach 1: Kenvue Discounted Cash Flow (DCF) Analysis
A Discounted Cash Flow model projects the cash Kenvue is expected to generate in the future and then discounts those projections back to today to estimate what the business is worth now.
Kenvue currently generates roughly $1.67 billion in free cash flow, and analysts see this growing steadily as the company scales its consumer health portfolio. Under Simply Wall St’s 2 Stage Free Cash Flow to Equity model, analyst estimates are used for the next few years, then extended by extrapolating growth assumptions further out, with free cash flow expected to reach around $2.80 billion by 2029 and continue rising into the early 2030s.
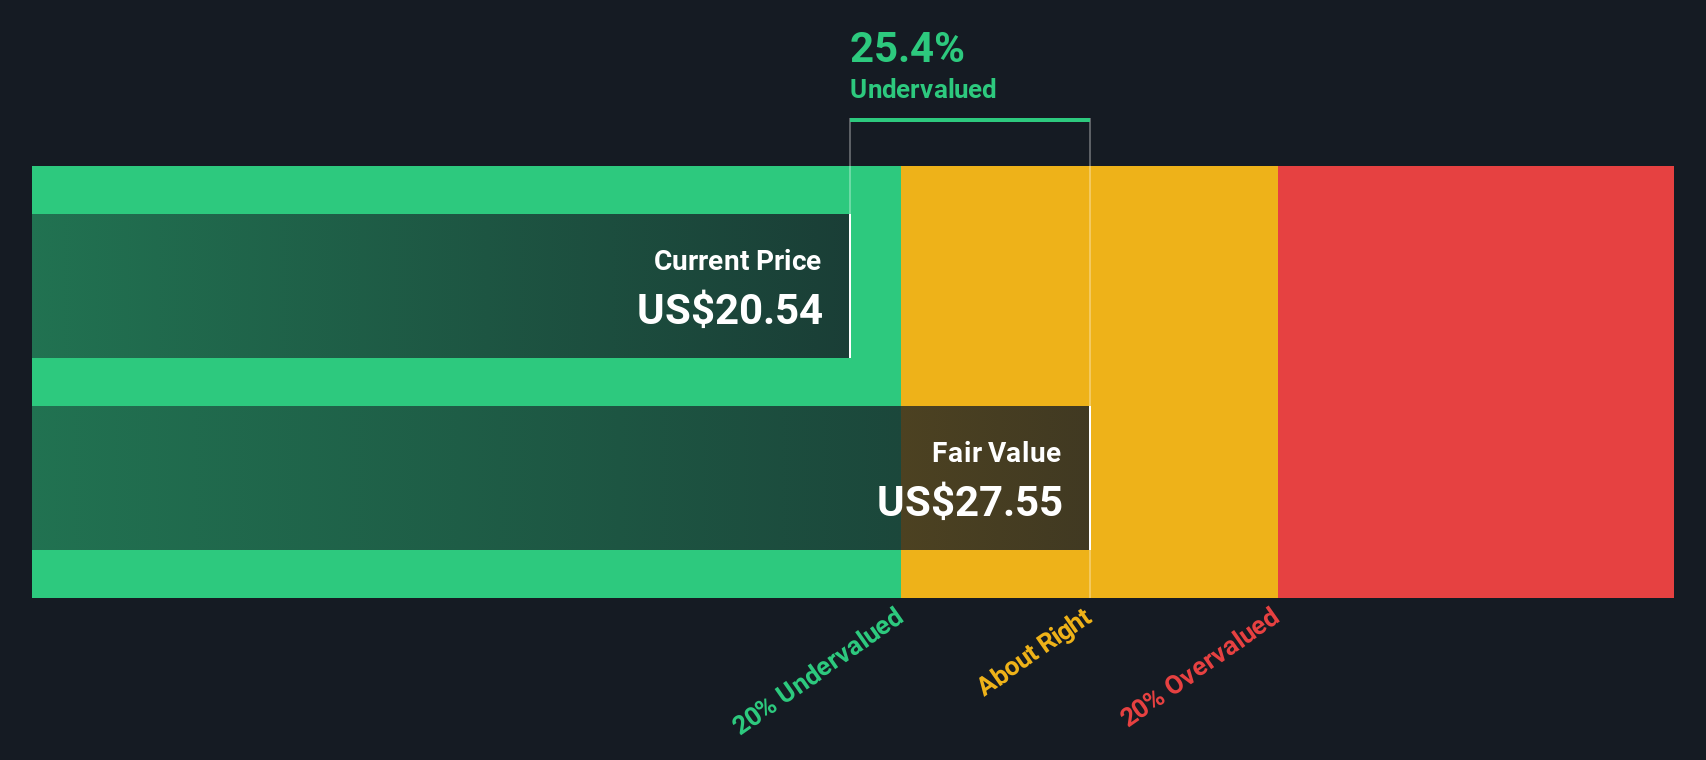
When all those future $ cash flows are discounted back, the model arrives at an intrinsic value of about $28.66 per share. Compared with the recent share price near $16.93, the DCF implies Kenvue is trading at roughly a 40.9% discount. This suggests investors are pricing in much weaker cash flow prospects than the model assumes.
Result: UNDERVALUED
Our Discounted Cash Flow (DCF) analysis suggests Kenvue is undervalued by 40.9%. Track this in your watchlist or portfolio, or discover 908 more undervalued stocks based on cash flows.
Approach 2: Kenvue Price vs Earnings
For a profitable, established business like Kenvue, the price to earnings (PE) ratio is a logical way to gauge whether investors are paying a reasonable price for each dollar of current earnings. In general, companies with stronger growth prospects and lower perceived risk can justify a higher PE, while slower growers or riskier names tend to trade on lower multiples.
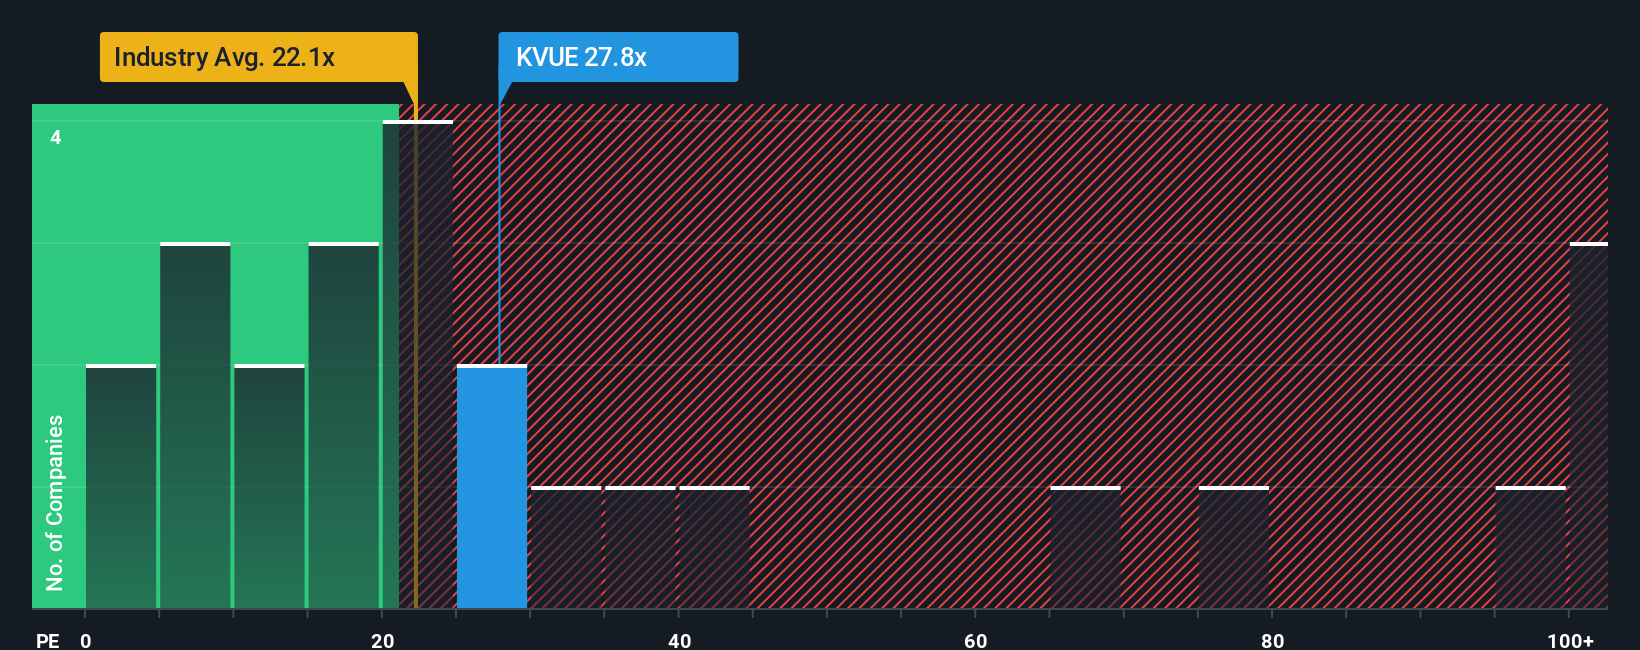
Kenvue currently trades on a PE of about 22.6x, which is broadly in line with the wider Personal Products industry at roughly 22.7x and below the peer group average near 29.1x. Simply Wall St also calculates a Fair Ratio of around 21.2x, a proprietary estimate of what Kenvue’s PE should be given its earnings growth outlook, profitability, industry, market cap and risk profile.
This Fair Ratio is more informative than a simple comparison to peers or industry averages because it adjusts for Kenvue specific fundamentals rather than assuming all companies deserve the same multiple. With the market paying about 22.6x versus a Fair Ratio of 21.2x, Kenvue screens as modestly expensive on earnings, but not dramatically out of line with what its fundamentals would suggest.
Result: OVERVALUED
PE ratios tell one story, but what if the real opportunity lies elsewhere? Discover 1452 companies where insiders are betting big on explosive growth.
Upgrade Your Decision Making: Choose your Kenvue Narrative
Narratives are simply your story about a company, brought to life through the numbers you think are realistic for its future revenue, earnings, and margins, and they connect that story to a financial forecast and, ultimately, to a Fair Value you can compare with today’s share price.
On Simply Wall St’s Community page, millions of investors use Narratives as an easy, guided tool to spell out what they believe will drive a business like Kenvue, translate those beliefs into forecasts, and instantly see how their Fair Value compares to today’s price.
Because Narratives update dynamically when new information lands, such as Kenvue’s legal headlines or the Kimberly Clark buyout news, your Fair Value view evolves automatically instead of sitting frozen in an old spreadsheet.
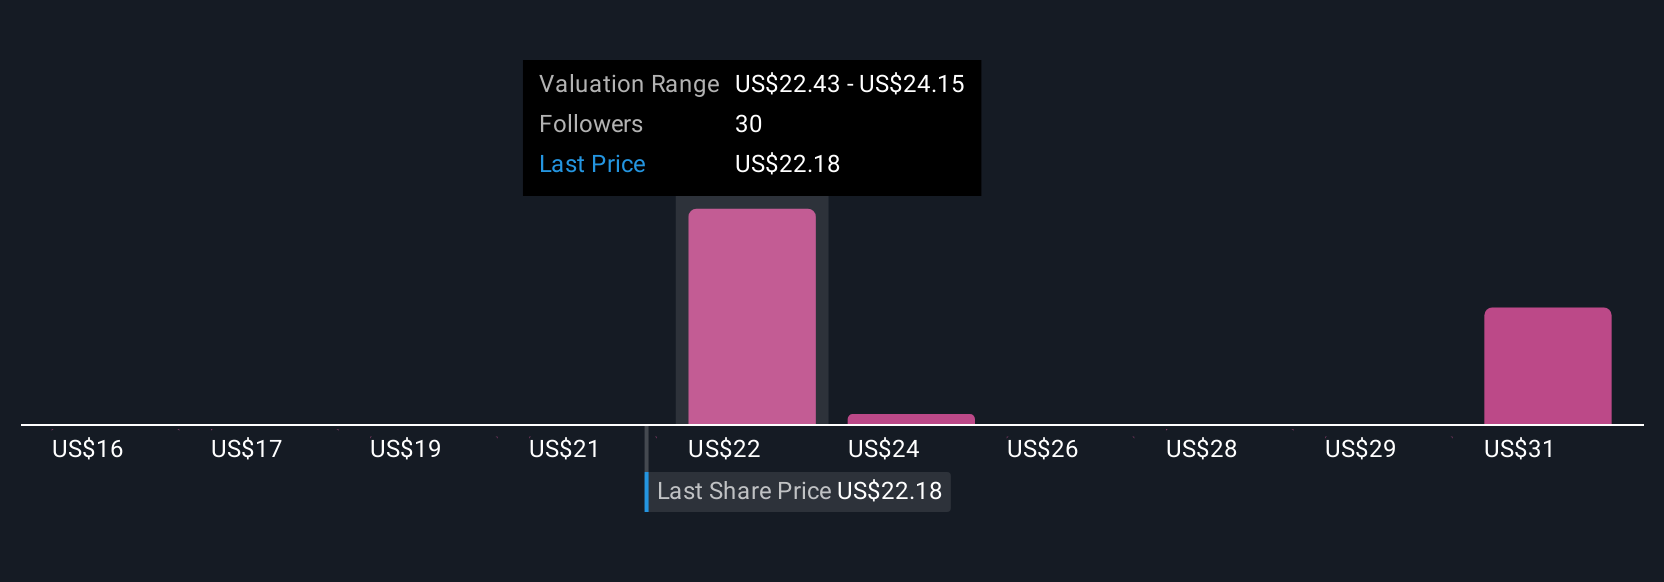
For example, a more optimistic Kenvue Narrative might lean toward the upper end of recent analyst targets around $26.00, assuming digital investments and emerging markets accelerate growth. In contrast, a more cautious Narrative could anchor closer to $19.00, reflecting higher legal risks and slower margin expansion. The gap between those Fair Values can then inform whether today’s price justifies taking action.
Do you think there's more to the story for Kenvue? Head over to our Community to see what others are saying!
This article by Simply Wall St is general in nature. We provide commentary based on historical data and analyst forecasts only using an unbiased methodology and our articles are not intended to be financial advice. It does not constitute a recommendation to buy or sell any stock, and does not take account of your objectives, or your financial situation. We aim to bring you long-term focused analysis driven by fundamental data. Note that our analysis may not factor in the latest price-sensitive company announcements or qualitative material. Simply Wall St has no position in any stocks mentioned.
Have feedback on this article? Concerned about the content? Get in touch with us directly. Alternatively, email editorial-team@simplywallst.com