
CG Oncology (CGON) Valuation Check After Strong Late-Breaking Cretostimogene Bladder Cancer Trial Results
CG Oncology (CGON) just released new topline data on its bladder cancer drug cretostimogene, with late-breaking BOND 003 and CORE 008 results highlighting strong responses and a clean-looking safety profile.
See our latest analysis for CG Oncology.
Those upbeat cretostimogene data land after a busy stretch for CG Oncology, including fresh SUO conference presentations and a new board appointment. The stock’s momentum reflects that, with a roughly 49 percent year to date share price return and a 30 percent one year total shareholder return off a 43.30 dollar share price.
If this kind of clinical momentum has your attention, it could be worth scanning other innovative healthcare names through healthcare stocks to see which ones are building similar traction in their pipelines.
But with CG Oncology still loss making and the share price already up sharply, are markets underestimating cretostimogene’s long term commercial potential, or is the current valuation already pricing in years of future growth?
Price-to-Book of 5.1x: Is it justified?
On a price-to-book basis, CG Oncology trades at 5.1 times its book value, which screens as good value versus its closest peers but expensive against the broader biotech group at the latest close of 43.30 dollars.
The price-to-book ratio compares the market value of the company to its net assets, a common yardstick for early stage or loss making biotechs where earnings are not yet a reliable guide. For CG Oncology, investors are effectively paying a premium to the accounting value of its clinical platform and cash, reflecting expectations that its bladder cancer franchise can translate into substantial future economics.
Peer comparisons, however, tell a more nuanced story. CG Oncology looks attractively valued against its immediate peers, where the average price-to-book multiple is around 8 times. This implies the market has not bid CG Oncology up to the frothiest levels. Yet relative to the wider US biotech industry, which trades at about 2.7 times book, the stock carries a sizeable premium. This suggests investors are already pricing in superior growth and clinical execution if current momentum continues.
See what the numbers say about this price — find out in our valuation breakdown.
Result: Price-to-Book of 5.1x (ABOUT RIGHT)
However, cretostimogene still faces pivotal trial risk and execution challenges, and any regulatory setback or slower uptake could quickly deflate today’s premium valuation.
Find out about the key risks to this CG Oncology narrative.
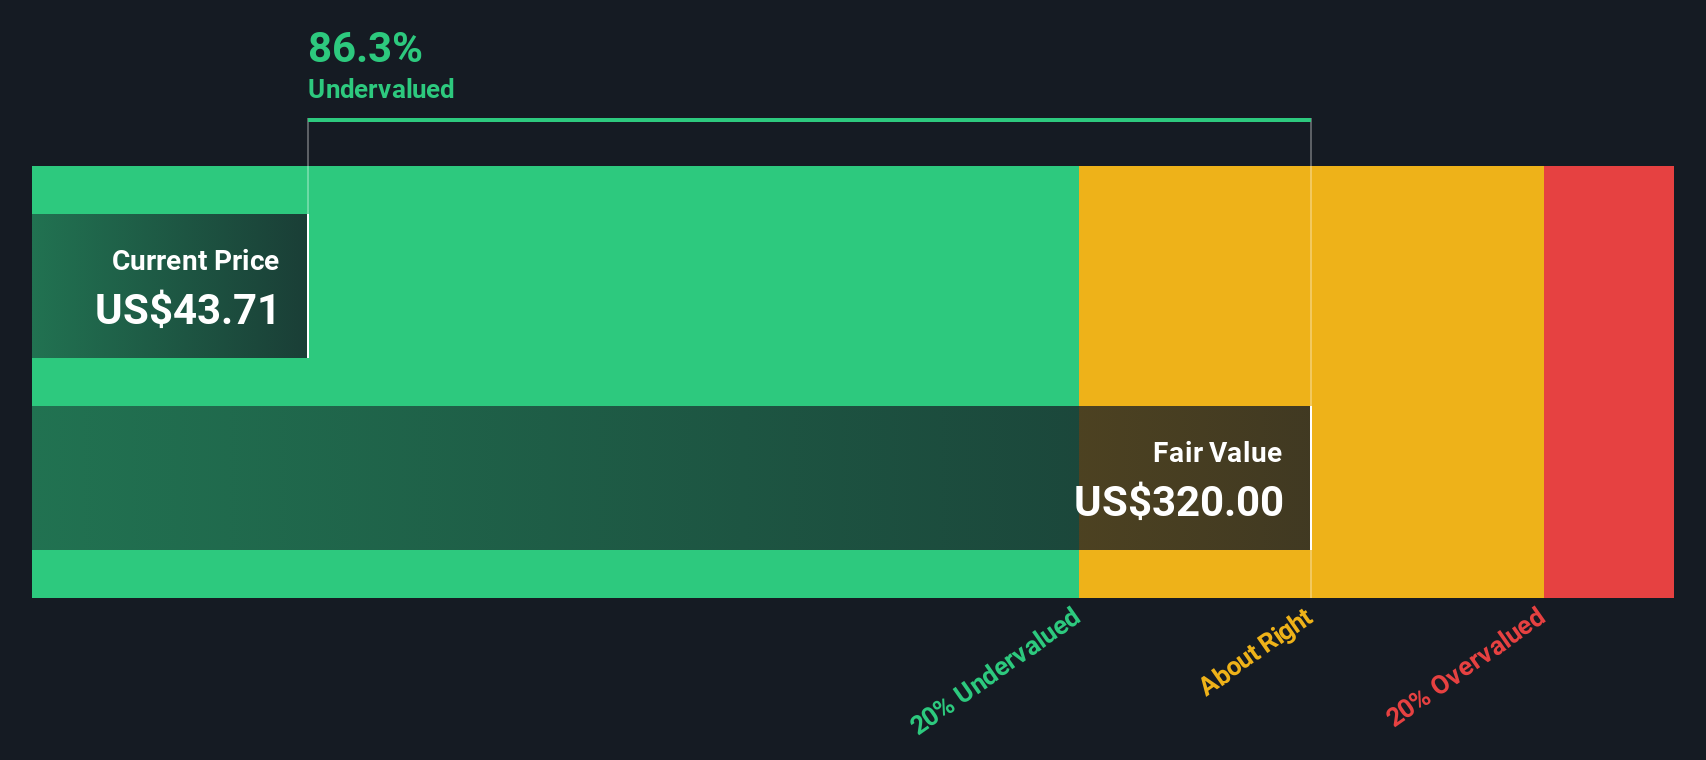
Another View: DCF Signals Deep Undervaluation
Our DCF model presents a different view, suggesting CG Oncology is trading around 89 percent below its estimated fair value of roughly 394.60 dollars per share. If that long term cash flow view is even partly accurate, the current price may represent a potential bargain.
Look into how the SWS DCF model arrives at its fair value.
Simply Wall St performs a discounted cash flow (DCF) on every stock in the world every day (check out CG Oncology for example). We show the entire calculation in full. You can track the result in your watchlist or portfolio and be alerted when this changes, or use our stock screener to discover 905 undervalued stocks based on their cash flows. If you save a screener we even alert you when new companies match - so you never miss a potential opportunity.
Build Your Own CG Oncology Narrative
If you see the numbers differently or want to stress test your own assumptions, you can build a personalized view in minutes: Do it your way.
A great starting point for your CG Oncology research is our analysis highlighting 2 key rewards and 3 important warning signs that could impact your investment decision.
Looking for more investment ideas?
Before you move on, explore your next potential move by scanning fresh opportunities that match your style, so you do not miss the next breakout.
- Identify high-upside potential early by targeting under the radar names through these 3578 penny stocks with strong financials that already show robust financial foundations.
- Align with structural trends by focusing on these 26 AI penny stocks positioned at the intersection of innovation, adoption, and revenue growth.
- Seek potential value by zeroing in on these 905 undervalued stocks based on cash flows that markets may be mispricing based on long term cash flow strength.
This article by Simply Wall St is general in nature. We provide commentary based on historical data and analyst forecasts only using an unbiased methodology and our articles are not intended to be financial advice. It does not constitute a recommendation to buy or sell any stock, and does not take account of your objectives, or your financial situation. We aim to bring you long-term focused analysis driven by fundamental data. Note that our analysis may not factor in the latest price-sensitive company announcements or qualitative material. Simply Wall St has no position in any stocks mentioned.
Have feedback on this article? Concerned about the content? Get in touch with us directly. Alternatively, email editorial-team@simplywallst.com