
Eli Lilly (LLY): Reassessing Valuation After a Sharp Three-Month Rally and Brief Pullback
Eli Lilly (LLY) has been on investors’ radar after a strong past 3 months, with the stock climbing roughly 33% even as it slipped about 6% over the past week.
See our latest analysis for Eli Lilly.
Zooming out, Eli Lilly’s recent pullback sits against a powerful backdrop, with a roughly 33% 3 month share price return and a standout multi year total shareholder return suggesting momentum is still broadly intact.
If Eli Lilly’s run has you rethinking your healthcare exposure, it could be a good time to explore other healthcare stocks that might complement your portfolio.
With the stock flirting with four figures and recent gains far outpacing the broader market, investors face a familiar dilemma: is Lilly still trading below its true potential, or has the market already priced in its next leg of growth?
Most Popular Narrative Narrative: 16.1% Undervalued
At a last close of $997.59 versus a narrative fair value near the low $1,200s, the story frames Eli Lilly as materially mispriced to the upside.
Market penetration for all GLP-1 drugs is only at 4% of a target audience of 100 to 120 million people in the USA alone. Still has a lot of room to penetrate for more than 1 GLP-1 drug.
Want to see how aggressive growth, rising margins and a punchy future earnings multiple all stack up into that lofty price tag? The crucial assumptions might surprise you. Curious which moving piece does most of the heavy lifting in this story? Read on to see what is really driving that valuation gap.
Result: Fair Value of $1200 (UNDERVALUED)
Have a read of the narrative in full and understand what's behind the forecasts.
However, sustained high pricing or unexpected safety concerns could quickly cool demand, compressing margins and challenging assumptions behind that 16.1% undervaluation narrative.
Find out about the key risks to this Eli Lilly narrative.
Another Angle on Valuation
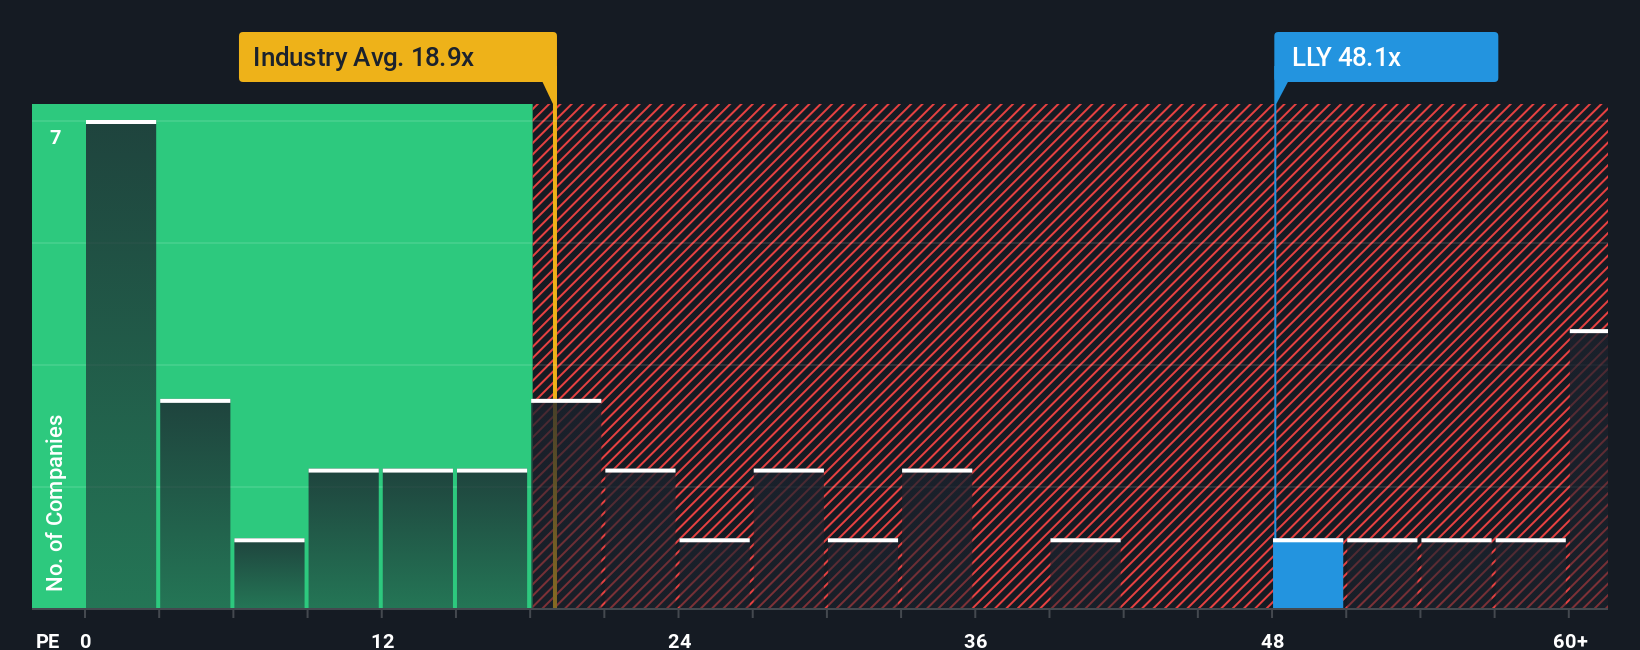
The narrative fair value paints LLY as 16% undervalued, but its 48.5x earnings multiple tells a tougher story. That is more than double the US pharma average of 19.5x and richer than a 42.7x fair ratio, hinting at a valuation where expectations leave little room for error. So which lens should investors trust?
See what the numbers say about this price — find out in our valuation breakdown.
Build Your Own Eli Lilly Narrative
If this perspective does not quite fit your view, or you prefer to dig into the numbers yourself, you can build a bespoke take in just minutes: Do it your way
A great starting point for your Eli Lilly research is our analysis highlighting 3 key rewards and 2 important warning signs that could impact your investment decision.
Looking for more investment ideas?
Before you move on, lock in your next steps by scanning a few high potential themes on Simply Wall Street’s screener so fresh opportunities do not slip past you.
- Target income focused opportunities by reviewing these 15 dividend stocks with yields > 3% that may help you build steadier, yield driven returns alongside growth names like Eli Lilly.
- Position yourself for the next wave of automation and data disruption by tracking these 27 AI penny stocks shaping everything from enterprise software to consumer experiences.
- Future proof your portfolio by assessing these 81 cryptocurrency and blockchain stocks that are building real world infrastructure around digital assets, payments, and blockchain ecosystems.
This article by Simply Wall St is general in nature. We provide commentary based on historical data and analyst forecasts only using an unbiased methodology and our articles are not intended to be financial advice. It does not constitute a recommendation to buy or sell any stock, and does not take account of your objectives, or your financial situation. We aim to bring you long-term focused analysis driven by fundamental data. Note that our analysis may not factor in the latest price-sensitive company announcements or qualitative material. Simply Wall St has no position in any stocks mentioned.
Have feedback on this article? Concerned about the content? Get in touch with us directly. Alternatively, email editorial-team@simplywallst.com