
Assessing Robinhood After Its 246% Surge and Expanding Trading Platform in 2025
- Wondering if Robinhood Markets at $136.43 is still a sensible buy after its massive run up, or if you are arriving just as the party is winding down?
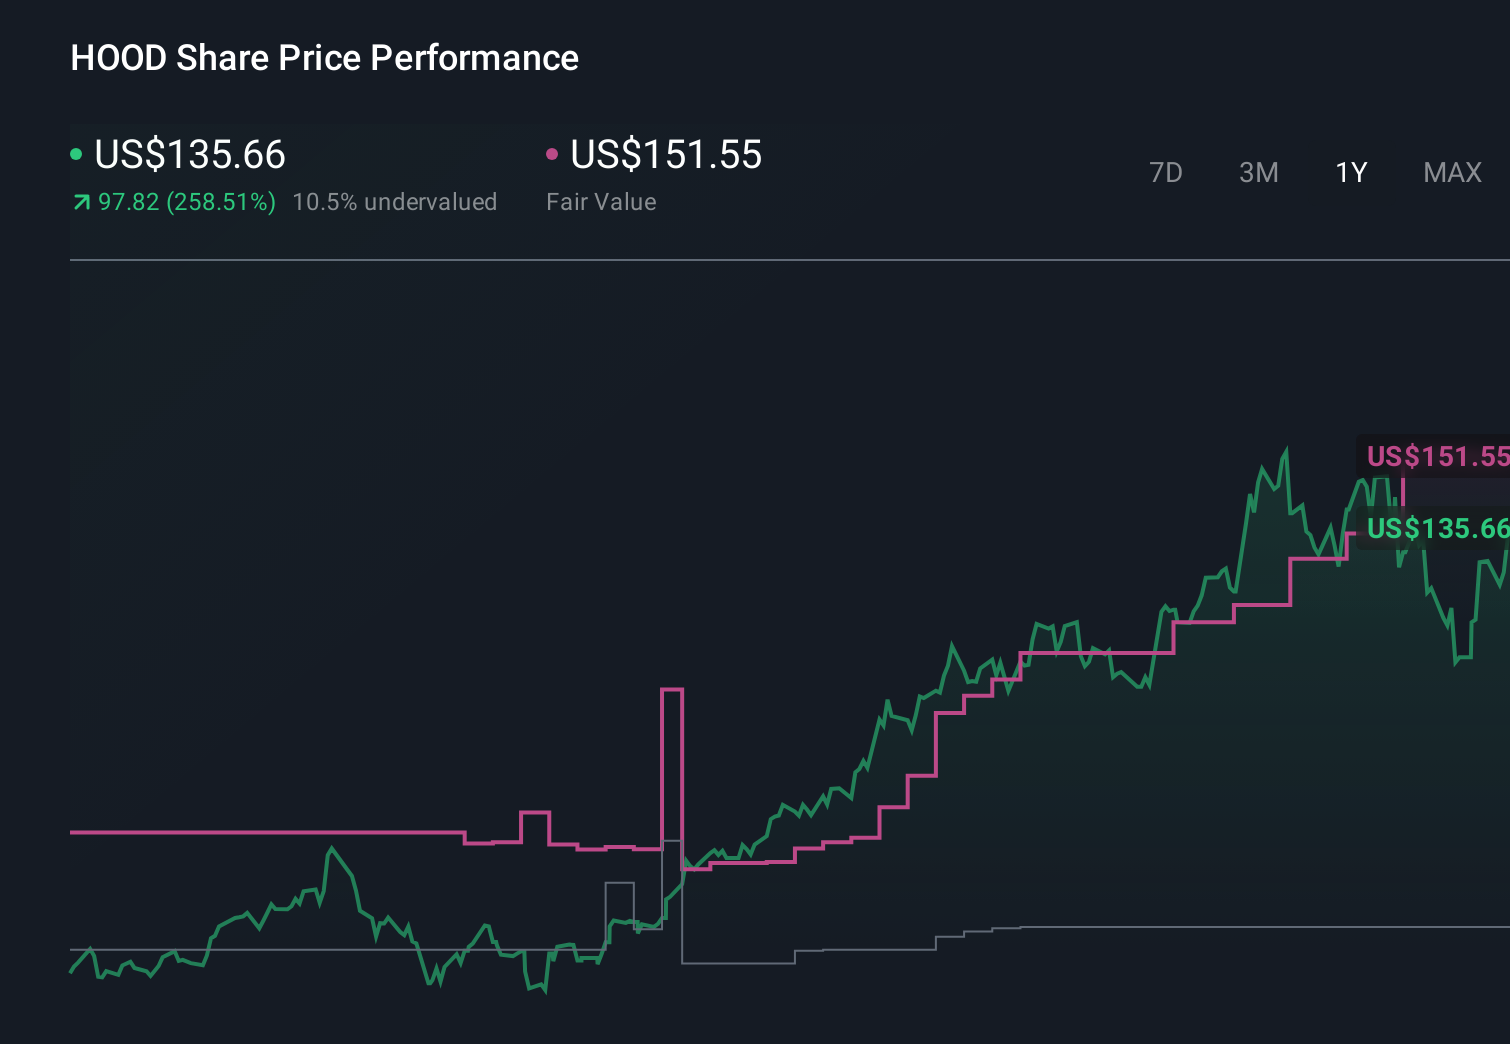
- The stock has climbed 10.7% over the last week and 4.7% over the last month, adding to a 245.9% gain year to date and 245.0% over the last year. The 3 year return sits at an eye catching 1324.1%.
- Those moves have come as Robinhood keeps broadening its platform with more assets and features for active traders and long term investors alike, and as retail trading interest has stayed surprisingly resilient. The stock has also been swept up in renewed enthusiasm for consumer fintech platforms that can scale quickly when market sentiment turns risk on.
- Despite that momentum, Robinhood currently scores just 0/6 on our valuation checks. This suggests the market may be pricing in a lot of future success already. Next we will unpack how different valuation methods view the stock, and then circle back to a way of thinking about valuation that ties all of this together.
Robinhood Markets scores just 0/6 on our valuation checks. See what other red flags we found in the full valuation breakdown.
Approach 1: Robinhood Markets Excess Returns Analysis
The Excess Returns model looks at how much profit a company can earn above its cost of equity, and then capitalizes those extra profits into a per share value. It is less about short term earnings swings and more about the durability of high returns on invested capital.
For Robinhood, the model assumes a Book Value of $9.53 per share and a Stable EPS of $2.60 per share, based on weighted future return on equity estimates from 8 analysts. With a Cost of Equity of $1.06 per share, that implies an Excess Return of $1.54 per share, supported by an Average Return on Equity of 20.72%. Analysts also expect Stable Book Value to rise to $12.57 per share, using forecasts from 5 analysts.
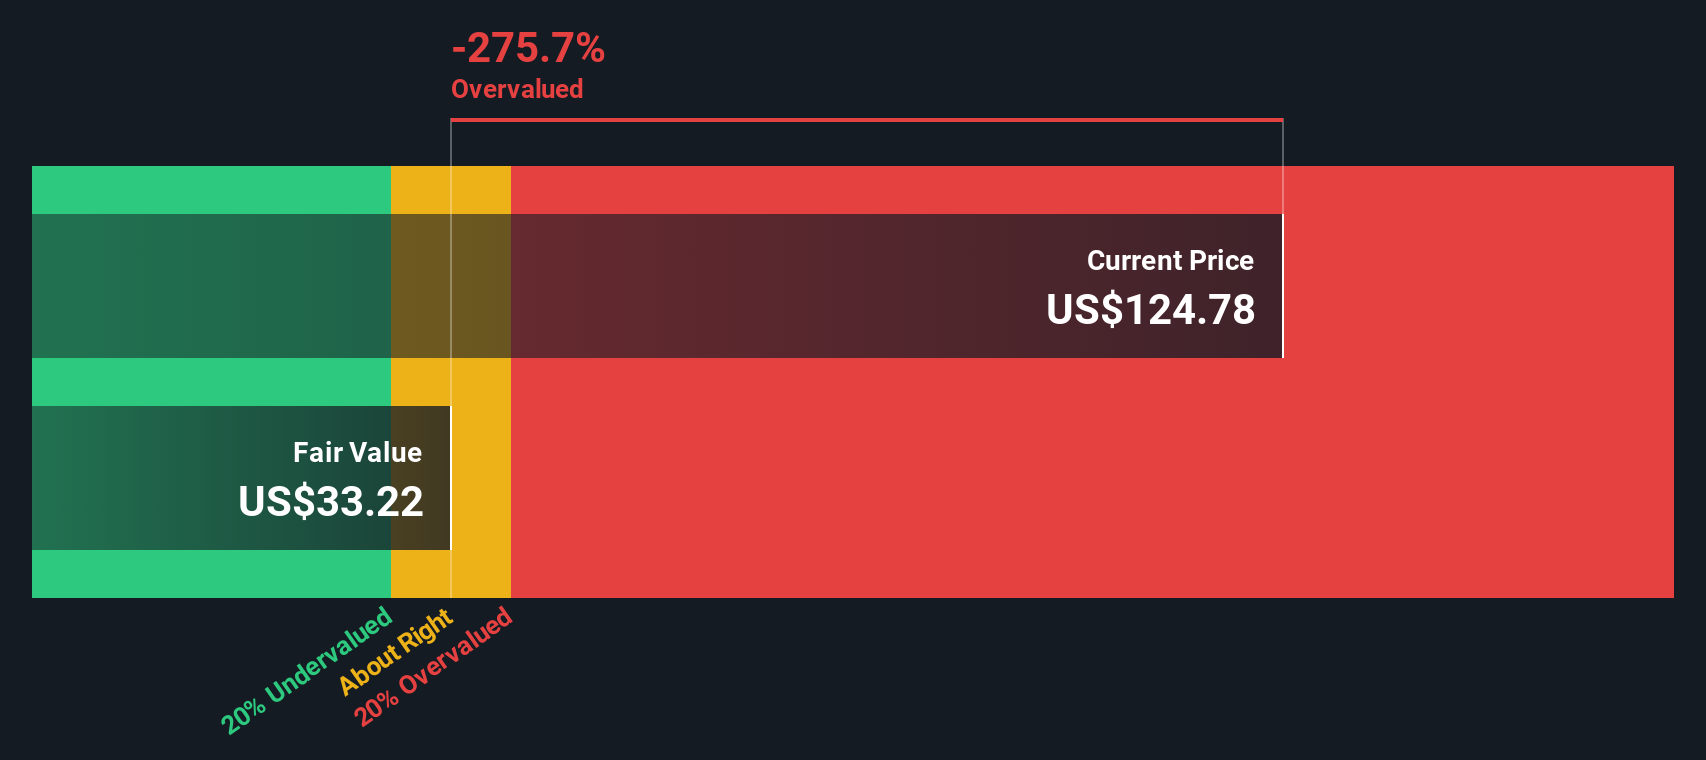
Putting these inputs together, the Excess Returns framework produces an intrinsic value of about $42.26 per share. With the current share price around $136.43, the model indicates the stock is roughly 222.8% above that intrinsic value estimate, meaning investors would be paying a large premium for future growth in this framework.
Result: OVERVALUED
Our Excess Returns analysis suggests Robinhood Markets may be overvalued by 222.8%. Discover 903 undervalued stocks or create your own screener to find better value opportunities.
Approach 2: Robinhood Markets Price vs Earnings
The price to earnings ratio is a useful yardstick for profitable companies because it directly links what investors are paying for each share to the earnings that business is generating today. In general, faster growth and lower perceived risk can justify a higher PE, while slower growth or higher risk usually call for a lower, more conservative multiple.
Robinhood currently trades on a PE of about 55.9x, which is more than double the Capital Markets industry average of roughly 25.0x and well above the peer group average of 22.2x. Simply Wall St also calculates a Fair Ratio of 27.3x, its proprietary view of what a reasonable PE should be once factors like Robinhood’s earnings growth profile, profit margins, risk, industry positioning and market capitalization are all accounted for.
This Fair Ratio is more informative than a simple comparison to peers or the broad industry, because it adjusts for company specific strengths and vulnerabilities rather than assuming that every Capital Markets stock deserves the same multiple. Compared with that 27.3x Fair Ratio, Robinhood’s current 55.9x suggests the market is paying a substantial premium for future growth and execution.
Result: OVERVALUED
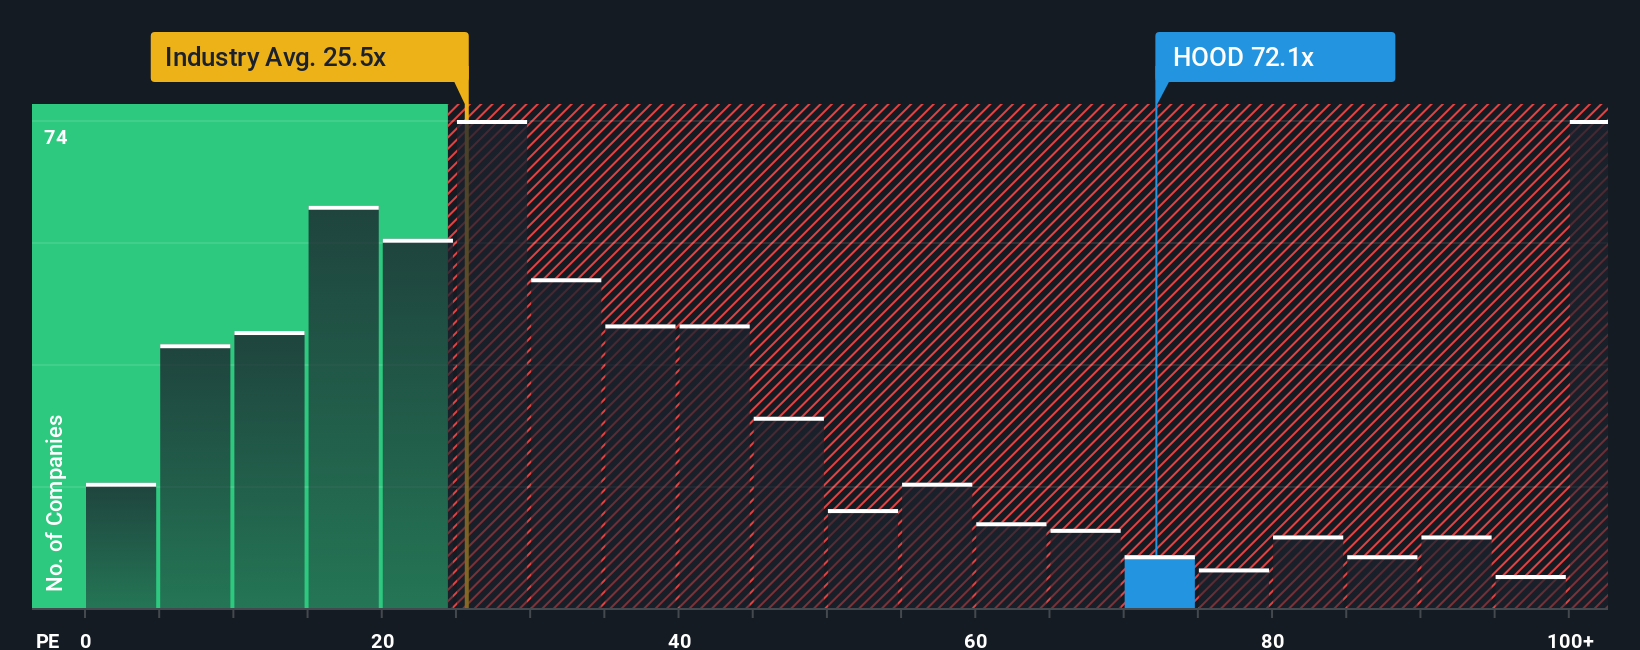
PE ratios tell one story, but what if the real opportunity lies elsewhere? Discover 1453 companies where insiders are betting big on explosive growth.
Upgrade Your Decision Making: Choose your Robinhood Markets Narrative
Earlier we mentioned that there is an even better way to understand valuation, so let us introduce you to Narratives, a simple framework where you connect your view of a company’s story to explicit assumptions about future revenue, earnings and margins, and then to a clear fair value that you can compare with today’s price.
On Simply Wall St’s Community page, Narratives let you spell out why you think Robinhood will win or struggle, translate that story into a forecast, and instantly see whether your fair value suggests the stock is appropriately valued at current levels.
Because Narratives are updated dynamically when fresh news, earnings or guidance arrives, your fair value can evolve in real time as the facts change, instead of being anchored to a stale model.
For Robinhood, for example, some investors build bullish Narratives with fair values around $160 that lean on prediction markets, MIAXdx and AI driven product expansion. More cautious Narratives cluster closer to $50, reflecting worries about regulation, competition and margin pressure. The platform makes it easy to see where your own view fits along that spectrum.
Do you think there's more to the story for Robinhood Markets? Head over to our Community to see what others are saying!
This article by Simply Wall St is general in nature. We provide commentary based on historical data and analyst forecasts only using an unbiased methodology and our articles are not intended to be financial advice. It does not constitute a recommendation to buy or sell any stock, and does not take account of your objectives, or your financial situation. We aim to bring you long-term focused analysis driven by fundamental data. Note that our analysis may not factor in the latest price-sensitive company announcements or qualitative material. Simply Wall St has no position in any stocks mentioned.
Have feedback on this article? Concerned about the content? Get in touch with us directly. Alternatively, email editorial-team@simplywallst.com