
A Look At The Intrinsic Value Of Image Scan Holdings Plc (LON:IGE)
Key Insights
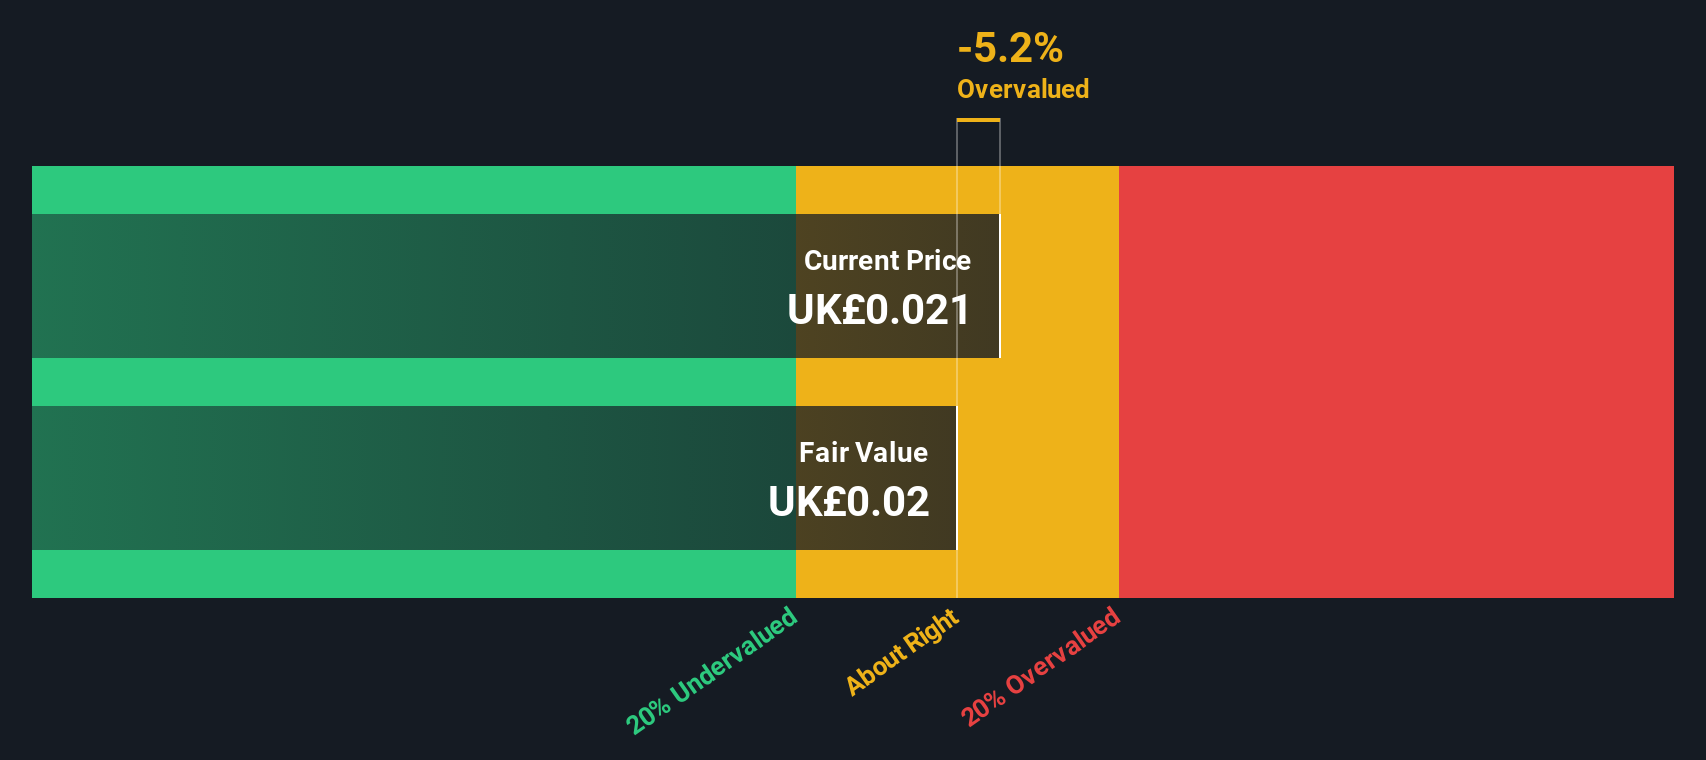
- Image Scan Holdings' estimated fair value is UK£0.02 based on 2 Stage Free Cash Flow to Equity
- Image Scan Holdings' UK£0.021 share price indicates it is trading at similar levels as its fair value estimate
- Industry average of 62% suggests Image Scan Holdings' peers are currently trading at a higher premium to fair value
Today we'll do a simple run through of a valuation method used to estimate the attractiveness of Image Scan Holdings Plc (LON:IGE) as an investment opportunity by taking the forecast future cash flows of the company and discounting them back to today's value. We will take advantage of the Discounted Cash Flow (DCF) model for this purpose. Don't get put off by the jargon, the math behind it is actually quite straightforward.
Remember though, that there are many ways to estimate a company's value, and a DCF is just one method. If you want to learn more about discounted cash flow, the rationale behind this calculation can be read in detail in the Simply Wall St analysis model.
Is Image Scan Holdings Fairly Valued?
We are going to use a two-stage DCF model, which, as the name states, takes into account two stages of growth. The first stage is generally a higher growth period which levels off heading towards the terminal value, captured in the second 'steady growth' period. To start off with, we need to estimate the next ten years of cash flows. Seeing as no analyst estimates of free cash flow are available to us, we have extrapolate the previous free cash flow (FCF) from the company's last reported value. We assume companies with shrinking free cash flow will slow their rate of shrinkage, and that companies with growing free cash flow will see their growth rate slow, over this period. We do this to reflect that growth tends to slow more in the early years than it does in later years.
A DCF is all about the idea that a dollar in the future is less valuable than a dollar today, so we need to discount the sum of these future cash flows to arrive at a present value estimate:
10-year free cash flow (FCF) forecast
| 2026 | 2027 | 2028 | 2029 | 2030 | 2031 | 2032 | 2033 | 2034 | 2035 | |
| Levered FCF (£, Millions) | UK£215.4k | UK£197.1k | UK£187.1k | UK£182.1k | UK£180.4k | UK£180.8k | UK£182.7k | UK£185.6k | UK£189.4k | UK£193.8k |
| Growth Rate Estimate Source | Est @ -13.47% | Est @ -8.53% | Est @ -5.07% | Est @ -2.65% | Est @ -0.96% | Est @ 0.22% | Est @ 1.05% | Est @ 1.63% | Est @ 2.04% | Est @ 2.33% |
| Present Value (£, Millions) Discounted @ 8.8% | UK£0.2 | UK£0.2 | UK£0.1 | UK£0.1 | UK£0.1 | UK£0.1 | UK£0.1 | UK£0.09 | UK£0.09 | UK£0.08 |
("Est" = FCF growth rate estimated by Simply Wall St)
Present Value of 10-year Cash Flow (PVCF) = UK£1.2m
The second stage is also known as Terminal Value, this is the business's cash flow after the first stage. For a number of reasons a very conservative growth rate is used that cannot exceed that of a country's GDP growth. In this case we have used the 5-year average of the 10-year government bond yield (3.0%) to estimate future growth. In the same way as with the 10-year 'growth' period, we discount future cash flows to today's value, using a cost of equity of 8.8%.
Terminal Value (TV)= FCF2035 × (1 + g) ÷ (r – g) = UK£194k× (1 + 3.0%) ÷ (8.8%– 3.0%) = UK£3.5m
Present Value of Terminal Value (PVTV)= TV / (1 + r)10= UK£3.5m÷ ( 1 + 8.8%)10= UK£1.5m
The total value is the sum of cash flows for the next ten years plus the discounted terminal value, which results in the Total Equity Value, which in this case is UK£2.7m. In the final step we divide the equity value by the number of shares outstanding. Relative to the current share price of UK£0.02, the company appears around fair value at the time of writing. Valuations are imprecise instruments though, rather like a telescope - move a few degrees and end up in a different galaxy. Do keep this in mind.
The Assumptions
The calculation above is very dependent on two assumptions. The first is the discount rate and the other is the cash flows. You don't have to agree with these inputs, I recommend redoing the calculations yourself and playing with them. The DCF also does not consider the possible cyclicality of an industry, or a company's future capital requirements, so it does not give a full picture of a company's potential performance. Given that we are looking at Image Scan Holdings as potential shareholders, the cost of equity is used as the discount rate, rather than the cost of capital (or weighted average cost of capital, WACC) which accounts for debt. In this calculation we've used 8.8%, which is based on a levered beta of 1.131. Beta is a measure of a stock's volatility, compared to the market as a whole. We get our beta from the industry average beta of globally comparable companies, with an imposed limit between 0.8 and 2.0, which is a reasonable range for a stable business.
View our latest analysis for Image Scan Holdings
SWOT Analysis for Image Scan Holdings
- Currently debt free.
- Current share price is above our estimate of fair value.
- Has sufficient cash runway for more than 3 years based on current free cash flows.
- Lack of analyst coverage makes it difficult to determine IGE's earnings prospects.
- No apparent threats visible for IGE.
Moving On:
Valuation is only one side of the coin in terms of building your investment thesis, and it shouldn't be the only metric you look at when researching a company. It's not possible to obtain a foolproof valuation with a DCF model. Instead the best use for a DCF model is to test certain assumptions and theories to see if they would lead to the company being undervalued or overvalued. For instance, if the terminal value growth rate is adjusted slightly, it can dramatically alter the overall result. For Image Scan Holdings, we've compiled three essential items you should assess:
- Risks: Take risks, for example - Image Scan Holdings has 3 warning signs (and 2 which are significant) we think you should know about.
- Other High Quality Alternatives: Do you like a good all-rounder? Explore our interactive list of high quality stocks to get an idea of what else is out there you may be missing!
- Other Environmentally-Friendly Companies: Concerned about the environment and think consumers will buy eco-friendly products more and more? Browse through our interactive list of companies that are thinking about a greener future to discover some stocks you may not have thought of!
PS. The Simply Wall St app conducts a discounted cash flow valuation for every stock on the AIM every day. If you want to find the calculation for other stocks just search here.
Have feedback on this article? Concerned about the content? Get in touch with us directly. Alternatively, email editorial-team (at) simplywallst.com.
This article by Simply Wall St is general in nature. We provide commentary based on historical data and analyst forecasts only using an unbiased methodology and our articles are not intended to be financial advice. It does not constitute a recommendation to buy or sell any stock, and does not take account of your objectives, or your financial situation. We aim to bring you long-term focused analysis driven by fundamental data. Note that our analysis may not factor in the latest price-sensitive company announcements or qualitative material. Simply Wall St has no position in any stocks mentioned.