
Institutions profited after CPI Card Group Inc.'s (NASDAQ:PMTS) market cap rose US$41m last week but private equity firms profited the most
Key Insights
- The considerable ownership by private equity firms in CPI Card Group indicates that they collectively have a greater say in management and business strategy
- The top 3 shareholders own 51% of the company
- Insiders have bought recently
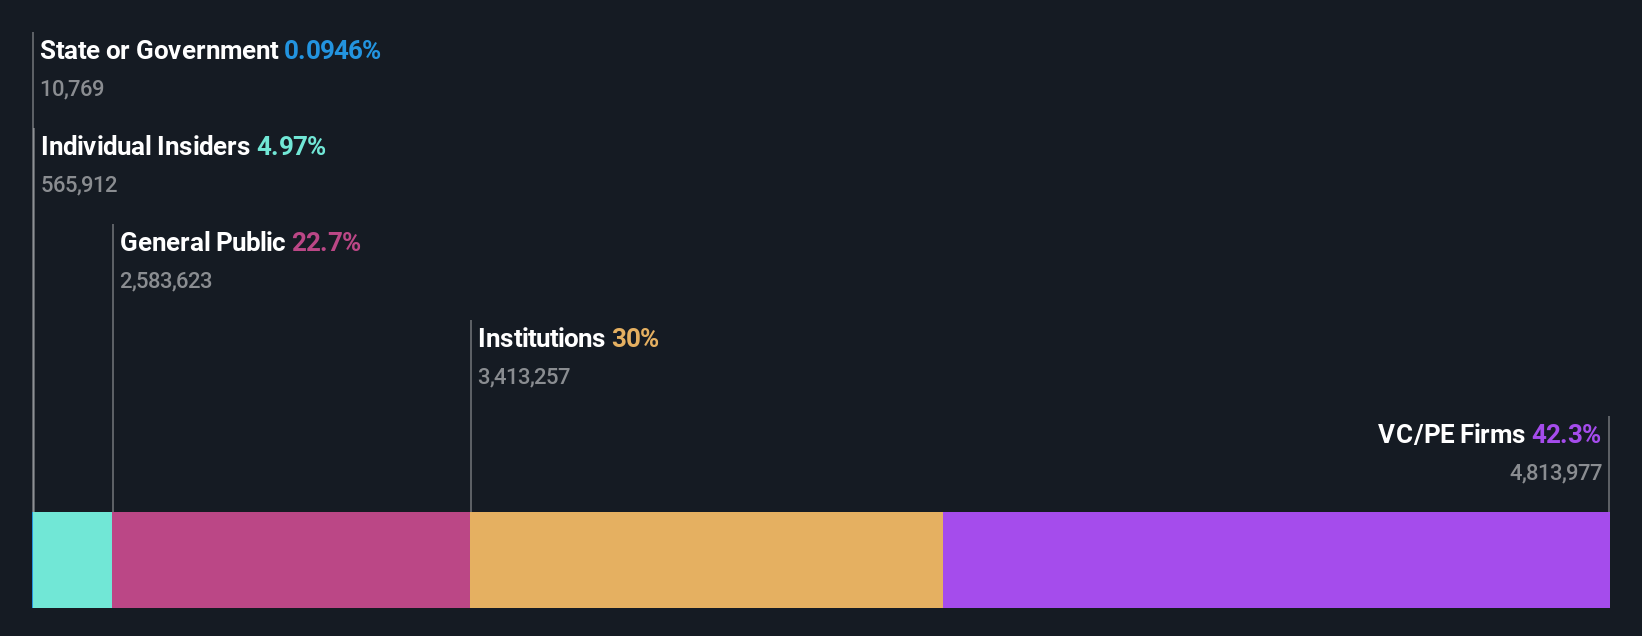
A look at the shareholders of CPI Card Group Inc. (NASDAQ:PMTS) can tell us which group is most powerful. And the group that holds the biggest piece of the pie are private equity firms with 42% ownership. Put another way, the group faces the maximum upside potential (or downside risk).
Following a 27% increase in the stock price last week, private equity firms profited the most, but institutions who own 30% stock also stood to gain from the increase.
Let's take a closer look to see what the different types of shareholders can tell us about CPI Card Group.
View our latest analysis for CPI Card Group
What Does The Institutional Ownership Tell Us About CPI Card Group?
Institutional investors commonly compare their own returns to the returns of a commonly followed index. So they generally do consider buying larger companies that are included in the relevant benchmark index.
CPI Card Group already has institutions on the share registry. Indeed, they own a respectable stake in the company. This implies the analysts working for those institutions have looked at the stock and they like it. But just like anyone else, they could be wrong. When multiple institutions own a stock, there's always a risk that they are in a 'crowded trade'. When such a trade goes wrong, multiple parties may compete to sell stock fast. This risk is higher in a company without a history of growth. You can see CPI Card Group's historic earnings and revenue below, but keep in mind there's always more to the story.

We note that hedge funds don't have a meaningful investment in CPI Card Group. Looking at our data, we can see that the largest shareholder is Parallel49 Equity, ULC with 42% of shares outstanding. In comparison, the second and third largest shareholders hold about 4.4% and 4.0% of the stock.
To make our study more interesting, we found that the top 3 shareholders have a majority ownership in the company, meaning that they are powerful enough to influence the decisions of the company.
While studying institutional ownership for a company can add value to your research, it is also a good practice to research analyst recommendations to get a deeper understand of a stock's expected performance. Quite a few analysts cover the stock, so you could look into forecast growth quite easily.
Insider Ownership Of CPI Card Group
While the precise definition of an insider can be subjective, almost everyone considers board members to be insiders. Management ultimately answers to the board. However, it is not uncommon for managers to be executive board members, especially if they are a founder or the CEO.
Most consider insider ownership a positive because it can indicate the board is well aligned with other shareholders. However, on some occasions too much power is concentrated within this group.
Shareholders would probably be interested to learn that insiders own shares in CPI Card Group Inc.. It has a market capitalization of just US$180m, and insiders have US$9.0m worth of shares, in their own names. This shows at least some alignment, but we usually like to see larger insider holdings. You can click here to see if those insiders have been buying or selling.
General Public Ownership
With a 23% ownership, the general public, mostly comprising of individual investors, have some degree of sway over CPI Card Group. While this group can't necessarily call the shots, it can certainly have a real influence on how the company is run.
Private Equity Ownership
Private equity firms hold a 42% stake in CPI Card Group. This suggests they can be influential in key policy decisions. Sometimes we see private equity stick around for the long term, but generally speaking they have a shorter investment horizon and -- as the name suggests -- don't invest in public companies much. After some time they may look to sell and redeploy capital elsewhere.
Next Steps:
While it is well worth considering the different groups that own a company, there are other factors that are even more important. For instance, we've identified 2 warning signs for CPI Card Group (1 shouldn't be ignored) that you should be aware of.
If you are like me, you may want to think about whether this company will grow or shrink. Luckily, you can check this free report showing analyst forecasts for its future.
NB: Figures in this article are calculated using data from the last twelve months, which refer to the 12-month period ending on the last date of the month the financial statement is dated. This may not be consistent with full year annual report figures.
Have feedback on this article? Concerned about the content? Get in touch with us directly. Alternatively, email editorial-team (at) simplywallst.com.
This article by Simply Wall St is general in nature. We provide commentary based on historical data and analyst forecasts only using an unbiased methodology and our articles are not intended to be financial advice. It does not constitute a recommendation to buy or sell any stock, and does not take account of your objectives, or your financial situation. We aim to bring you long-term focused analysis driven by fundamental data. Note that our analysis may not factor in the latest price-sensitive company announcements or qualitative material. Simply Wall St has no position in any stocks mentioned.