
Is Allison Transmission Still Attractive After Recent Share Price Rebound?
- Wondering if Allison Transmission Holdings at around $95 a share is a bargain or a trap? You are not alone, and this breakdown is designed to help you decide if the current price still makes sense.
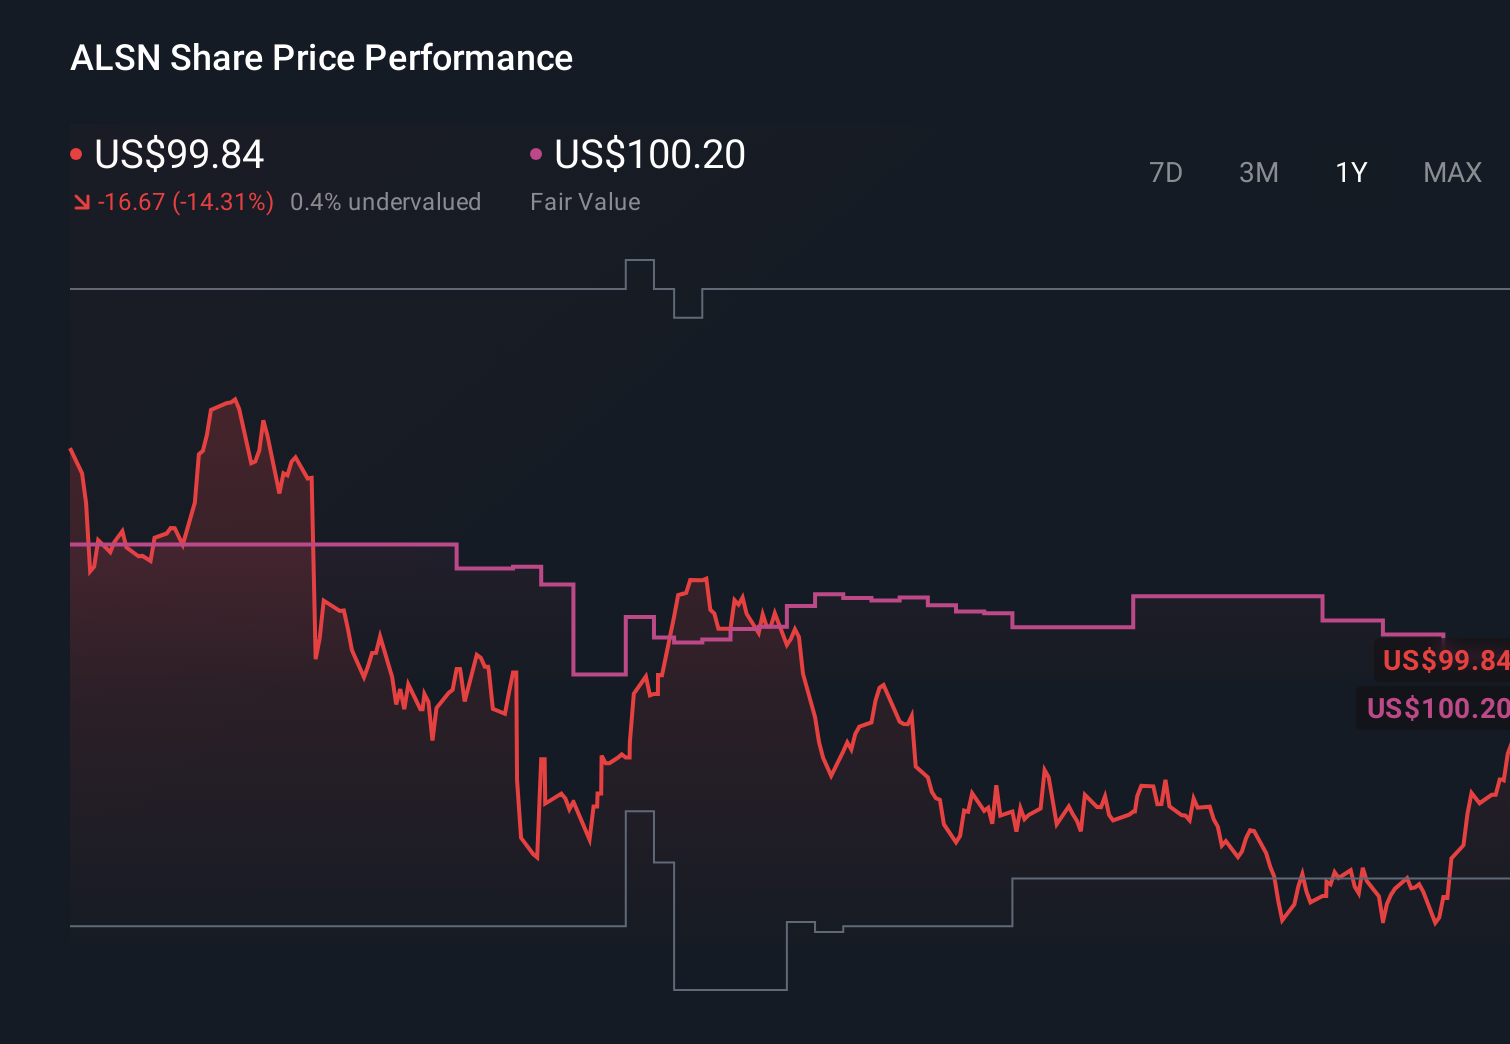
- The stock has climbed 6.4% over the last week and 16.0% over the last month, but that sits against a tougher backdrop of a -11.7% return year to date and -15.5% over the last year, despite a 132.2% gain over 3 years and 147.1% over 5 years.
- Recent moves have been driven less by a single headline and more by an evolving narrative around heavy duty vehicle demand, long term infrastructure investment in commercial fleets, and the company’s positioning in vocational and defense applications. At the same time, investors are rethinking how durable Allison Transmission Holdings' cash flows and margins might be through the cycle as the industry gradually shifts toward more electrified drivetrains.
- On our numbers Allison Transmission Holdings scores a solid 5 out of 6 on undervaluation checks. We will unpack this using multiple valuation approaches, and we will finish by looking at a more intuitive way to tie those valuations back to the long term story behind the stock.
Approach 1: Allison Transmission Holdings Discounted Cash Flow (DCF) Analysis
A Discounted Cash Flow model estimates what a business is worth by projecting the cash it can generate in the future and then discounting those cash flows back to today in $ terms. For Allison Transmission Holdings, the 2 Stage Free Cash Flow to Equity model starts with last twelve months free cash flow of about $654 million and applies analyst forecasts for the next several years, then extrapolates longer term growth beyond the explicit forecast horizon.
Analysts and model estimates see free cash flow rising toward roughly $1.56 billion by 2035, with a steady moderation in growth rates as the company matures. Simply Wall St discounts each year’s projected free cash flow back to today to arrive at a total equity value, and then divides by the number of shares to estimate a fair value per share.
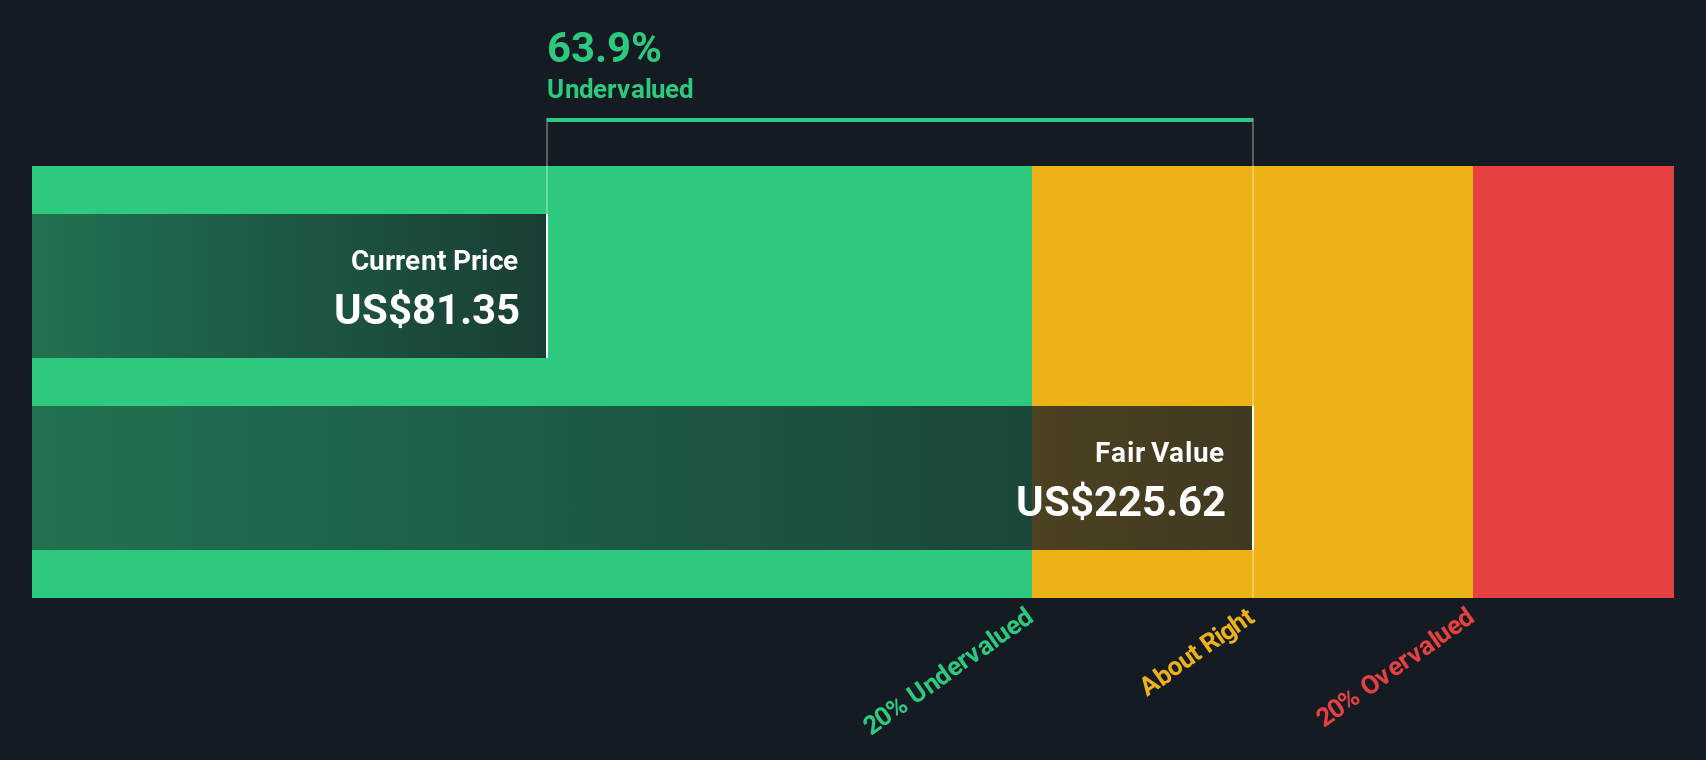
On this basis, the intrinsic value is calculated at about $227 per share, implying the stock is trading at a roughly 58.1% discount to its modeled fair value at current prices near $95. On the DCF view, Allison Transmission Holdings appears materially undervalued rather than fully priced according to this model.
Result: UNDERVALUED
Our Discounted Cash Flow (DCF) analysis suggests Allison Transmission Holdings is undervalued by 58.1%. Track this in your watchlist or portfolio, or discover 909 more undervalued stocks based on cash flows.
Approach 2: Allison Transmission Holdings Price vs Earnings
For profitable, established businesses like Allison Transmission Holdings, the price to earnings ratio is a practical way to gauge what investors are willing to pay today for each dollar of current profits. It naturally links valuation to earnings power, which tends to be more stable and intuitive for mature industrial companies than revenue or book value.
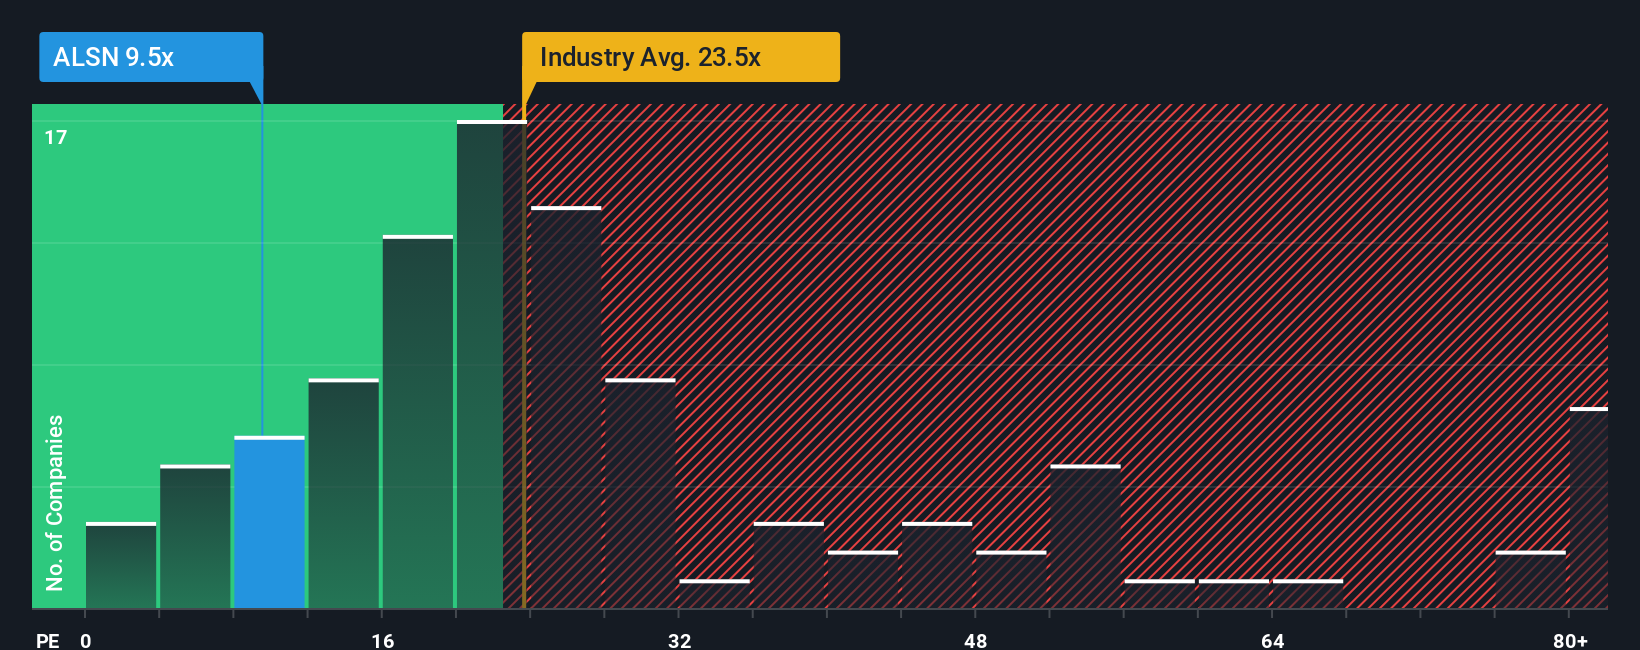
In general, faster growing and lower risk companies tend to trade on a higher, or more expensive, PE multiple, while slower growth or higher uncertainty tends to be associated with a lower one. Allison currently trades on a PE of about 11.3x. That is well below both the Machinery industry average of roughly 25.1x and the peer group average of around 20.6x, suggesting the market is pricing its earnings at a discount to many competitors.
Simply Wall St also uses a Fair Ratio framework, which estimates what PE multiple a company might trade on after factoring in its earnings growth outlook, profitability, risk profile, size, and industry. This can be more informative than a simple peer or industry comparison because it adjusts for Allison’s specific characteristics. Allison’s Fair PE Ratio is estimated at about 23.3x, notably higher than its current 11.3x, indicating that on this measure the shares may be trading below that estimated level.
Result: UNDERVALUED
PE ratios tell one story, but what if the real opportunity lies elsewhere? Discover 1452 companies where insiders are betting big on explosive growth.
Upgrade Your Decision Making: Choose your Allison Transmission Holdings Narrative
Earlier we mentioned that there is an even better way to understand valuation. Let us introduce you to Narratives, a simple way to turn your view of Allison Transmission Holdings into a structured story that connects assumptions about future revenue, earnings, and margins to a financial forecast, a fair value estimate, and ultimately a clear buy or sell decision on Simply Wall St’s Community page. This is where millions of investors share and compare these views as they automatically update when fresh news or earnings arrive. For example, one investor might build a bullish Narrative around value based pricing, resilient defense contracts, and high margin aftermarket growth that supports a fair value well above today’s price. Another might create a more cautious Narrative focused on truck cycle headwinds, electrification risk, and integration challenges that leads to a materially lower fair value. By setting up and tracking these Narratives side by side, you can quickly see whether your fair value is above or below the current market price and decide if ALSN belongs on your buy, hold, or watch list.
Do you think there's more to the story for Allison Transmission Holdings? Head over to our Community to see what others are saying!
This article by Simply Wall St is general in nature. We provide commentary based on historical data and analyst forecasts only using an unbiased methodology and our articles are not intended to be financial advice. It does not constitute a recommendation to buy or sell any stock, and does not take account of your objectives, or your financial situation. We aim to bring you long-term focused analysis driven by fundamental data. Note that our analysis may not factor in the latest price-sensitive company announcements or qualitative material. Simply Wall St has no position in any stocks mentioned.
Have feedback on this article? Concerned about the content? Get in touch with us directly. Alternatively, email editorial-team@simplywallst.com