
Aura Minerals (AUGO): Assessing Valuation After a 250% One-Year Share Price Surge
Aura Minerals (AUGO) has quietly delivered a powerful run this year, with the stock up well over 200% year to date and roughly 26% in the past 3 months, catching the attention of value-focused investors.
See our latest analysis for Aura Minerals.
At around $40.38 per share, Aura’s recent pullback comes after a powerful year, with the 30 day share price return of 17.76% and a 1 year total shareholder return of 252.85% suggesting momentum is still firmly in the stock’s favor.
If Aura’s run has you thinking about what else could surprise to the upside, now is a good time to explore fast growing stocks with high insider ownership.
But with Aura still trading below analyst targets and a sizeable gap to some intrinsic value estimates despite strong recent gains, is the market underestimating its next leg of growth or already pricing in a golden future?
Price-to-Sales of 4.4x: Is it justified?
Aura Minerals last closed at $40.38, and the stock is trading on a price to sales ratio of 4.4x, a level that points to a rich valuation versus key benchmarks.
The price to sales multiple compares what investors are paying for each dollar of Aura’s revenue, a useful lens for a company that is currently unprofitable but still generating solid top line growth. For a gold and copper producer that is forecast to grow revenue faster than the wider US market, this kind of revenue based yardstick helps frame whether the market is already baking in a bullish growth path.
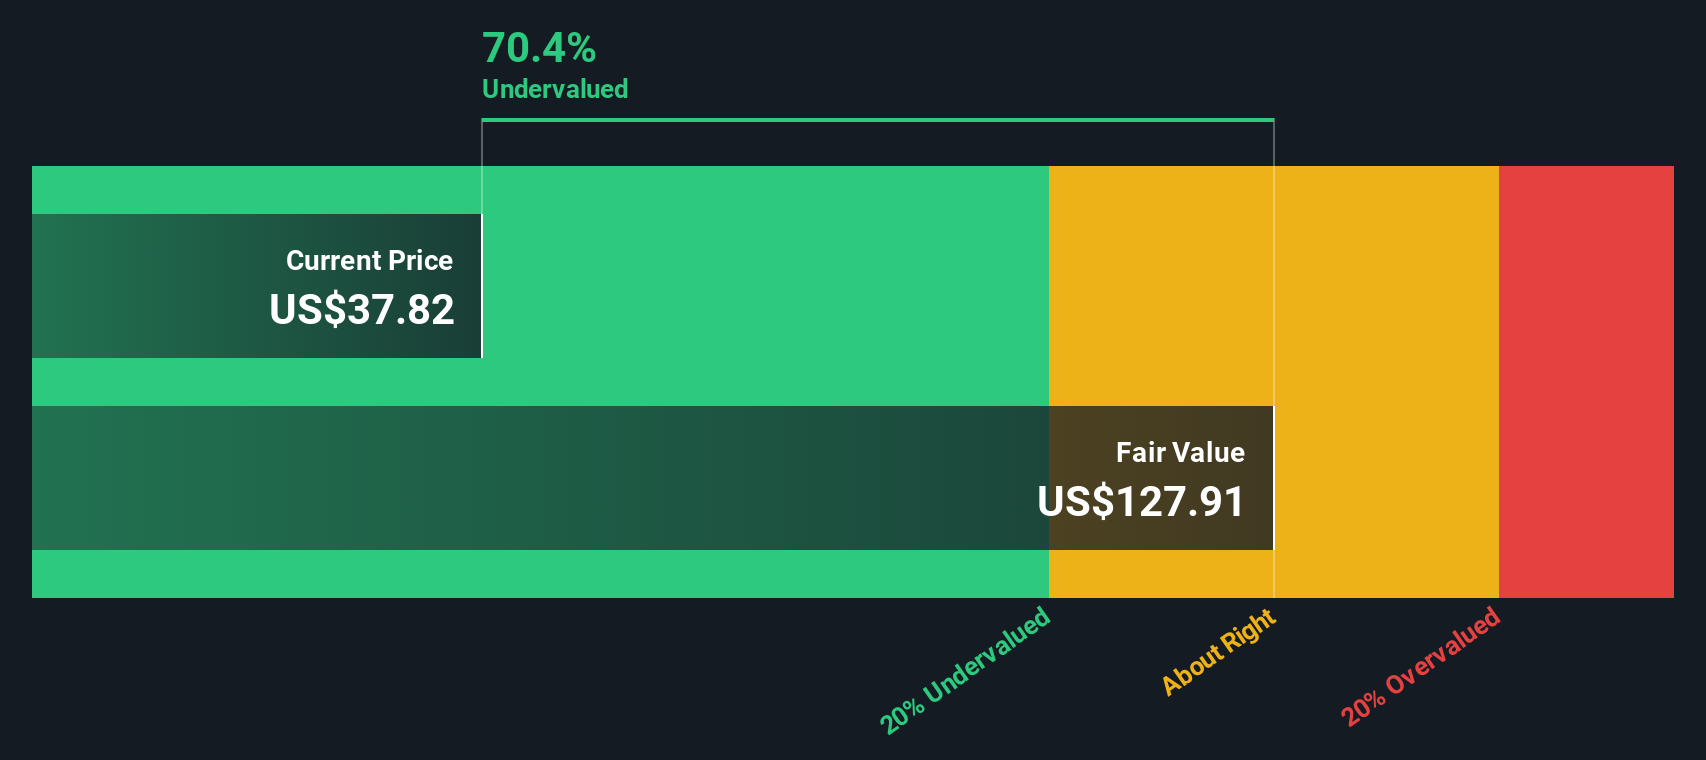
Against its own fundamentals, the 4.4x price to sales tag looks stretched, sitting above the SWS fair price to sales estimate of 3.8x. Our regression based analysis suggests that this lower level would better balance price with Aura’s financial profile. This indicates that the current valuation assumes more optimism than the fair ratio implies, even as the SWS DCF model flags the shares as trading about 65% below its intrinsic value estimate of $115.44. This highlights a sharp tension between near term revenue based pricing and long term cash flow potential.
On a pure peer check, Aura’s 4.4x price to sales multiple is more than double the broader US Metals and Mining industry average of around 2x. This underlines how much more investors are paying for each dollar of Aura’s revenue than for typical miners. However, when lined up against a tighter peer set, that same 4.4x looks more restrained, coming in below the 5.4x average. This suggests that within its higher growth, higher quality subset of comparables, Aura’s valuation is not at the very top of the range.
Explore the SWS fair ratio for Aura Minerals
Result: Price-to-Sales of 4.4x (OVERVALUED)
However, Aura’s ongoing losses and premium revenue multiple leave little room for operational missteps or weaker commodity prices to derail the bullish case.
Find out about the key risks to this Aura Minerals narrative.
Another View: DCF Points to Deep Value
While the 4.4x price to sales ratio suggests Aura is expensive on revenue, our DCF model says something very different. It flags the shares as trading about 65% below an intrinsic value estimate of $115.44. Is the market mispricing future cash flows, or is the DCF too optimistic?
Look into how the SWS DCF model arrives at its fair value.
Simply Wall St performs a discounted cash flow (DCF) on every stock in the world every day (check out Aura Minerals for example). We show the entire calculation in full. You can track the result in your watchlist or portfolio and be alerted when this changes, or use our stock screener to discover 909 undervalued stocks based on their cash flows. If you save a screener we even alert you when new companies match - so you never miss a potential opportunity.
Build Your Own Aura Minerals Narrative
If you see Aura’s story differently or simply want to dig into the numbers yourself, you can build a personalized view in minutes, Do it your way.
A great starting point for your Aura Minerals research is our analysis highlighting 2 key rewards and 2 important warning signs that could impact your investment decision.
Looking for more investment ideas?
Do not let Aura be the only potential winner on your radar. Use Simply Wall St’s powerful screeners to pinpoint other opportunities before the crowd notices.
- Capture early stage potential by scanning these 3593 penny stocks with strong financials that pair tiny share prices with real fundamentals instead of hype.
- Ride structural trends in automation and data by targeting these 27 AI penny stocks positioned to benefit as AI spending accelerates worldwide.
- Lock in compelling entry points with these 909 undervalued stocks based on cash flows that our models flag as trading below the cash flows they are expected to generate.
This article by Simply Wall St is general in nature. We provide commentary based on historical data and analyst forecasts only using an unbiased methodology and our articles are not intended to be financial advice. It does not constitute a recommendation to buy or sell any stock, and does not take account of your objectives, or your financial situation. We aim to bring you long-term focused analysis driven by fundamental data. Note that our analysis may not factor in the latest price-sensitive company announcements or qualitative material. Simply Wall St has no position in any stocks mentioned.
Have feedback on this article? Concerned about the content? Get in touch with us directly. Alternatively, email editorial-team@simplywallst.com