
Assessing Adobe’s Valuation After Steep 38.1% Share Price Decline
- Wondering if Adobe is finally priced for opportunity or still riding on old hype? Here is a walk-through of what the numbers really say about where value might be hiding in this stock.
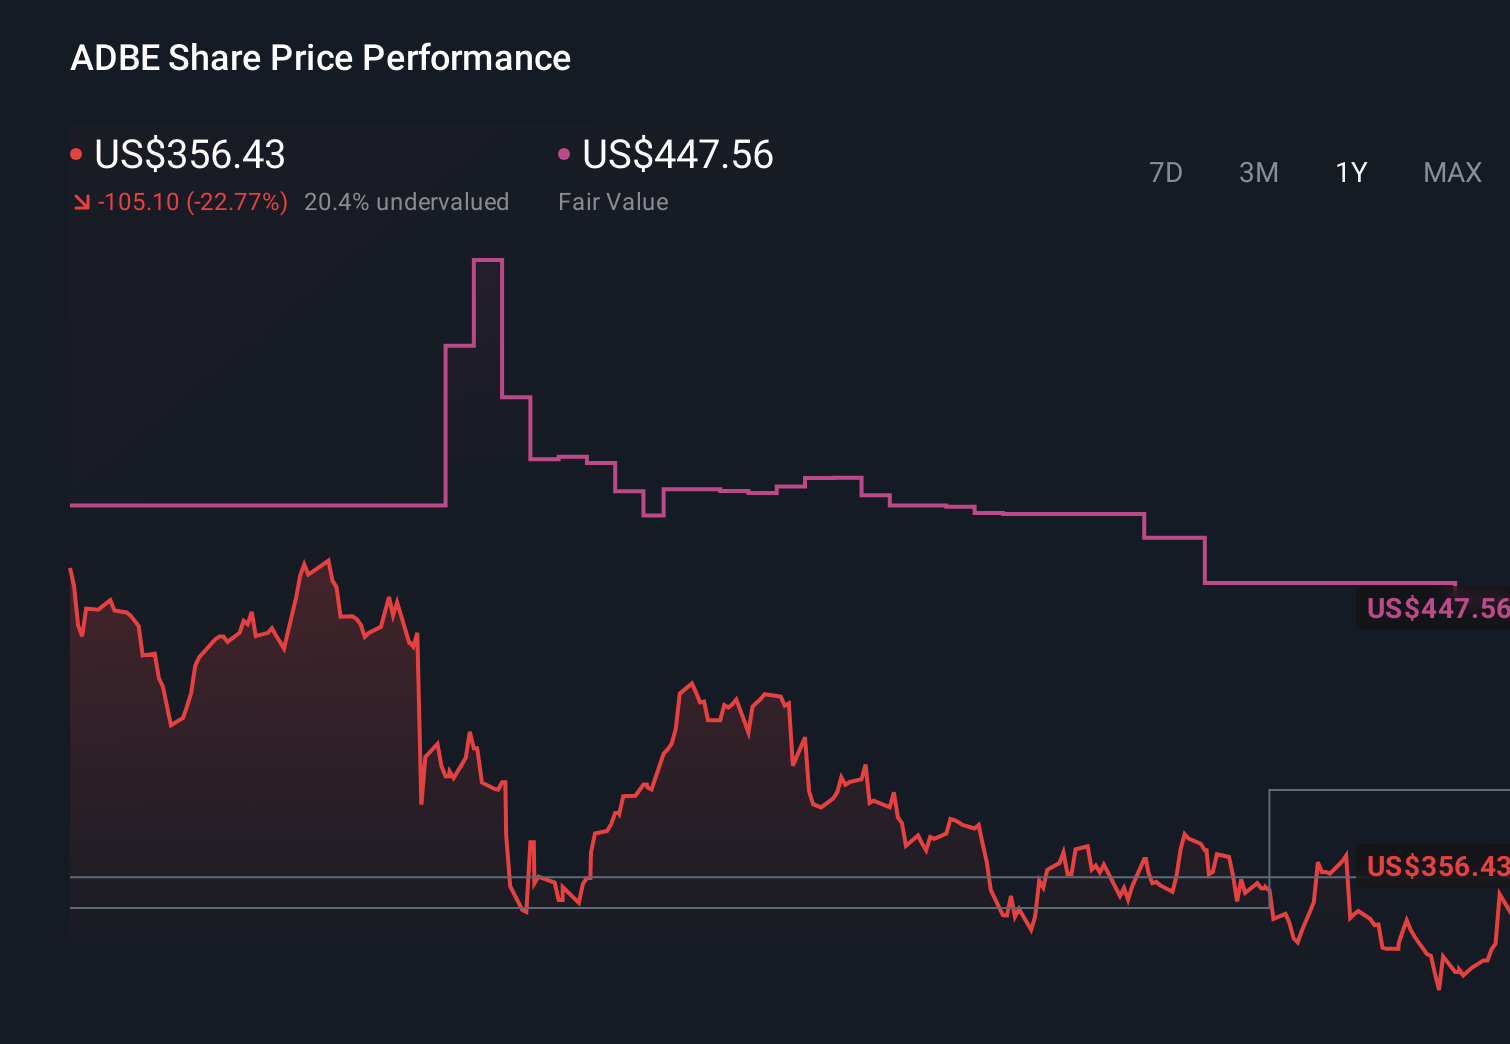
- Adobe has had a choppy ride lately, with shares up 5.0% over the last week and 3.7% over the past month, but still down 23.1% year to date and 38.1% over the last year, which indicates that sentiment has swung hard.
- Recent headlines have focused on Adobe doubling down on its AI driven creative tools and deepening integration across Creative Cloud and Experience Cloud, reinforcing its role at the center of digital content workflows. At the same time, regulators and competition chatter around big tech platforms have kept risk perceptions in play, which helps explain why the stock has not simply bounced straight back.
- Despite that mixed backdrop, Adobe scores a solid 5 out of 6 on our undervaluation checks. This suggests the market may be underestimating its long term cash generating power. Next we break down the standard valuation approaches investors use on Adobe before exploring an even more insightful way to think about what it is really worth.
Find out why Adobe's -38.1% return over the last year is lagging behind its peers.
Approach 1: Adobe Discounted Cash Flow (DCF) Analysis
A Discounted Cash Flow, or DCF, model estimates what a business is worth today by projecting its future cash flows and then discounting them back into today’s dollars. For Adobe, the model used is a 2 Stage Free Cash Flow to Equity approach, which captures a period of higher growth before fading to a more mature trajectory.
Adobe generated about $9.5 billion in Free Cash Flow over the last twelve months, and analyst forecasts, supplemented by Simply Wall St’s extrapolations, see this rising to roughly $16.0 billion by 2035. These projections are all in $ and reflect a steady, compounding expansion in the company’s cash generating ability as its subscription base deepens and margins remain strong.
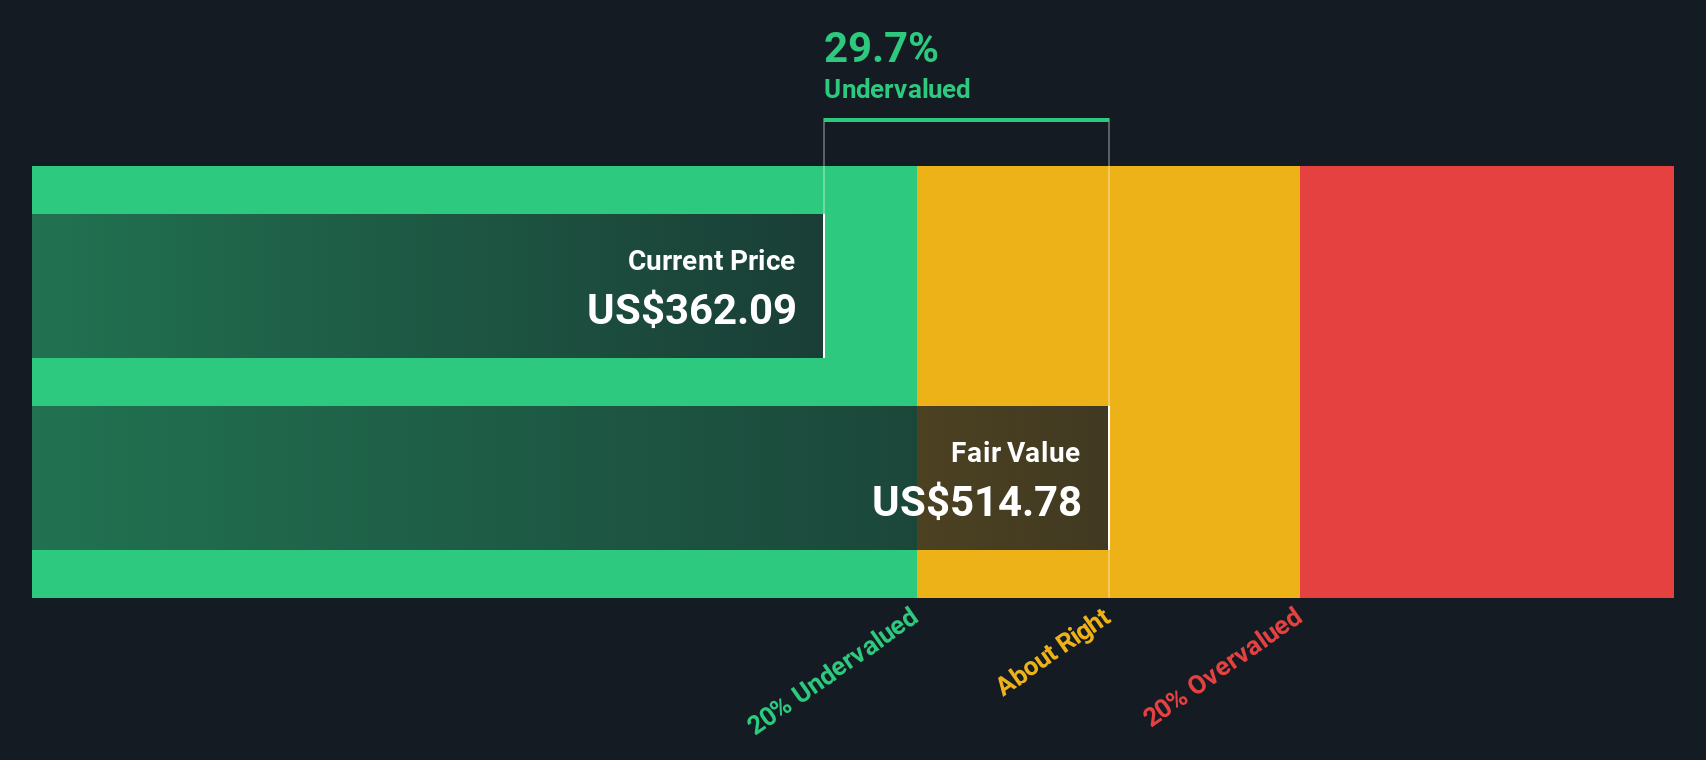
When those annual cash flows from 2026 onward are discounted back, the model arrives at an estimated intrinsic value of about $525.66 per share. That is roughly 35.5% above where the stock is currently trading, which suggests the market is pricing Adobe well below its modeled long term cash flow potential.
Result: UNDERVALUED
Our Discounted Cash Flow (DCF) analysis suggests Adobe is undervalued by 35.5%. Track this in your watchlist or portfolio, or discover 908 more undervalued stocks based on cash flows.
Approach 2: Adobe Price vs Earnings
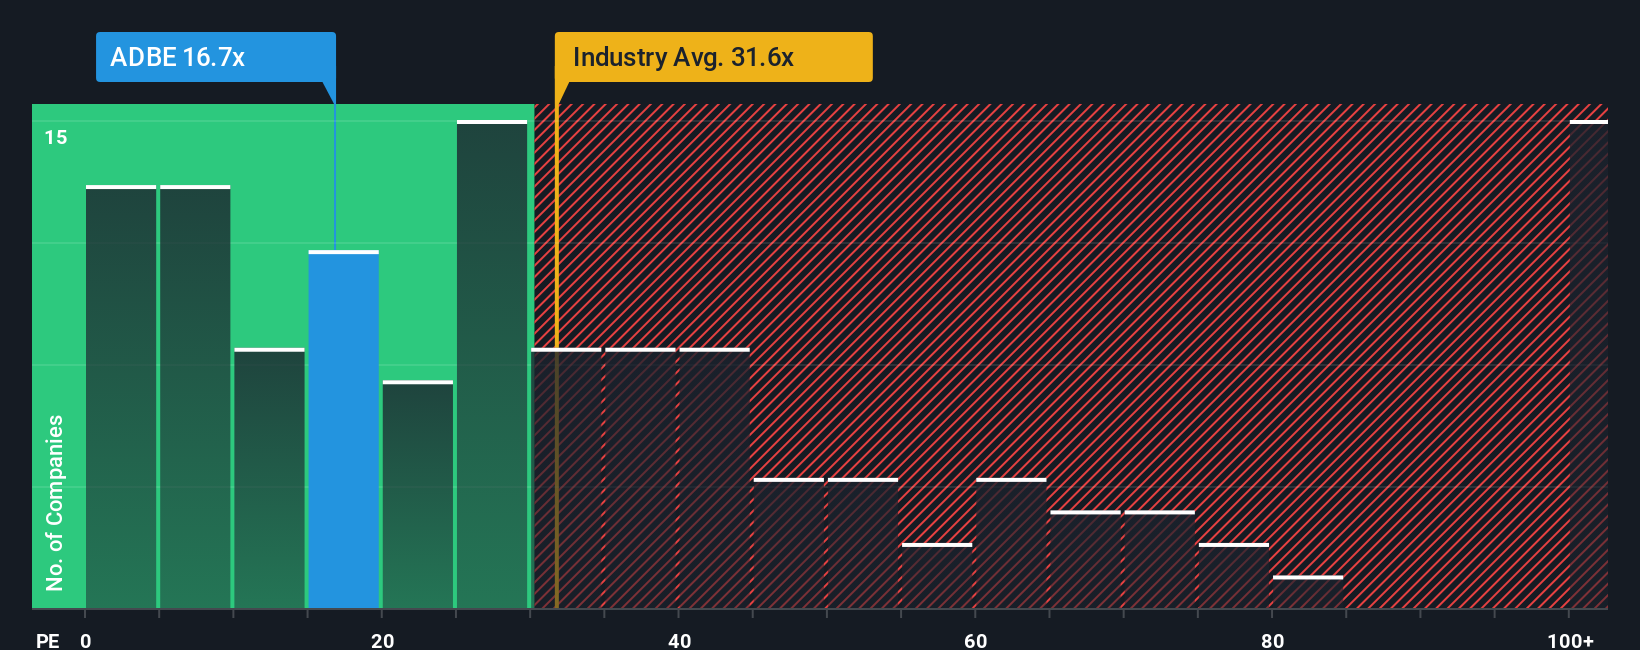
For profitable, established software businesses like Adobe, the Price to Earnings, or P E, ratio is a practical way to gauge how much investors are paying for each dollar of current profit. What counts as a normal or fair P E depends on how quickly earnings are expected to grow and how risky those earnings are, with higher growth and lower risk typically justifying a higher multiple.
Adobe currently trades on a P E of about 20.4x, which is well below both the broader Software industry average of roughly 32.0x and the peer group average near 60.2x. Simply Wall St’s proprietary Fair Ratio model, which blends factors like Adobe’s earnings growth outlook, margins, industry positioning, size and risk profile, suggests a fair P E closer to 35.8x. Because this framework tailors the benchmark to Adobe’s specific fundamentals rather than relying on blunt industry or peer comparisons, it offers a more nuanced view of value. On that basis, Adobe’s current 20.4x multiple looks meaningfully below its modeled fair range, indicating that the shares may be trading at a discount if the company delivers on expectations.
Result: UNDERVALUED
PE ratios tell one story, but what if the real opportunity lies elsewhere? Discover 1451 companies where insiders are betting big on explosive growth.
Upgrade Your Decision Making: Choose your Adobe Narrative
Earlier we mentioned that there is an even better way to understand valuation, so let us introduce you to Narratives, a simple way to connect your view of a company’s story with the numbers behind its future and what you think is a fair price today.
A Narrative is your own investment storyline for Adobe, where you spell out how you expect its revenue, earnings and margins to evolve, and then link that story directly to a financial forecast and resulting fair value.
On Simply Wall St, Narratives are an easy, accessible tool on the Community page that millions of investors already use to see how their story compares with others, to help decide whether a stock may be attractive or unattractive by comparing Fair Value to the current share price, and to automatically keep that view up to date as new news, earnings and other data points arrive.
For example, one investor Narrative might see Adobe as worth about $380 per share based on slower growth and margin pressure, while another might justify a fair value closer to $605 per share on stronger AI adoption, which shows how different but clearly articulated stories can lead to very different decisions.
Do you think there's more to the story for Adobe? Head over to our Community to see what others are saying!
This article by Simply Wall St is general in nature. We provide commentary based on historical data and analyst forecasts only using an unbiased methodology and our articles are not intended to be financial advice. It does not constitute a recommendation to buy or sell any stock, and does not take account of your objectives, or your financial situation. We aim to bring you long-term focused analysis driven by fundamental data. Note that our analysis may not factor in the latest price-sensitive company announcements or qualitative material. Simply Wall St has no position in any stocks mentioned.
Have feedback on this article? Concerned about the content? Get in touch with us directly. Alternatively, email editorial-team@simplywallst.com