
LATAM Airlines Group S.A.'s (SNSE:LTM) biggest owners are private companies who got richer after stock soared 5.2% last week
Key Insights
- The considerable ownership by private companies in LATAM Airlines Group indicates that they collectively have a greater say in management and business strategy
- A total of 8 investors have a majority stake in the company with 51% ownership
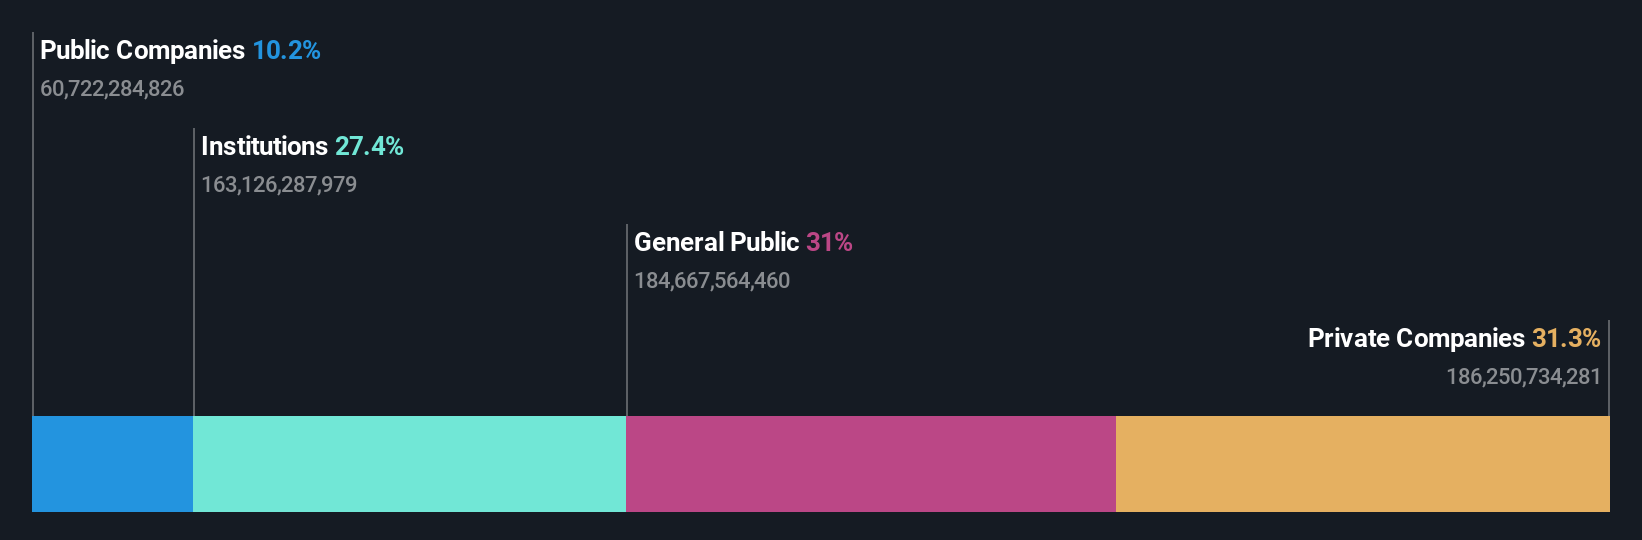
- Institutions own 27% of LATAM Airlines Group
To get a sense of who is truly in control of LATAM Airlines Group S.A. (SNSE:LTM), it is important to understand the ownership structure of the business. With 31% stake, private companies possess the maximum shares in the company. That is, the group stands to benefit the most if the stock rises (or lose the most if there is a downturn).
As a result, private companies collectively scored the highest last week as the company hit CL$14t market cap following a 5.2% gain in the stock.
Let's take a closer look to see what the different types of shareholders can tell us about LATAM Airlines Group.
View our latest analysis for LATAM Airlines Group
What Does The Institutional Ownership Tell Us About LATAM Airlines Group?
Institutional investors commonly compare their own returns to the returns of a commonly followed index. So they generally do consider buying larger companies that are included in the relevant benchmark index.
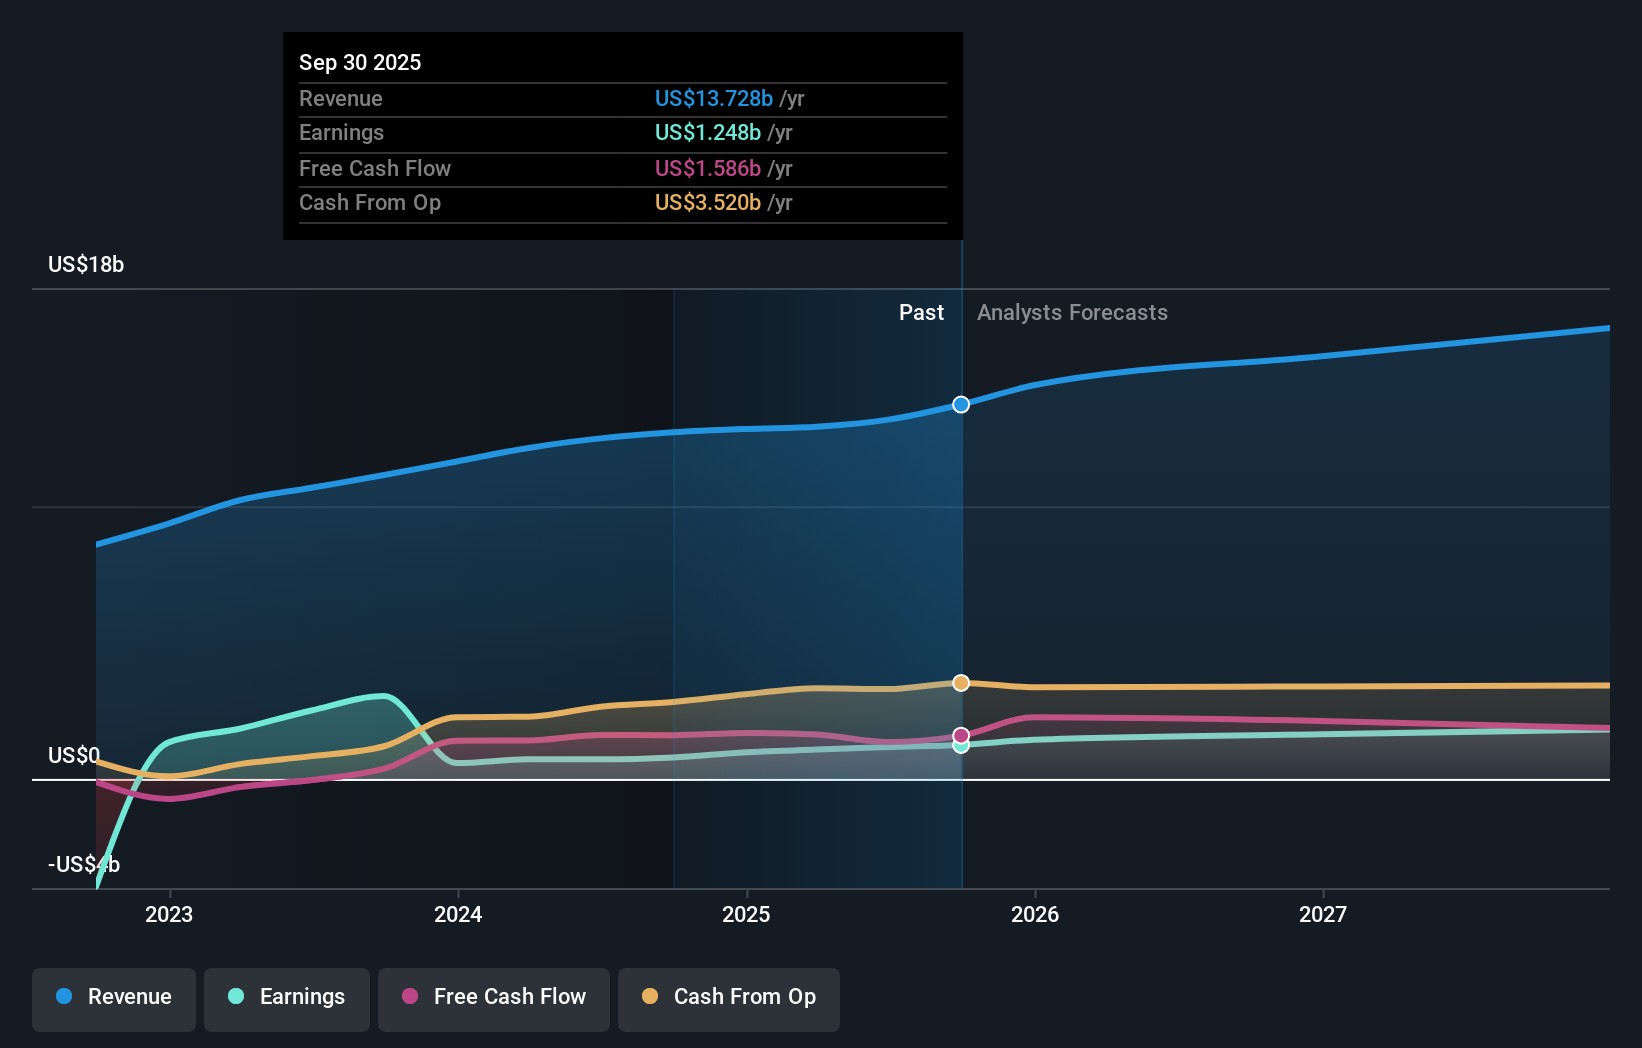
As you can see, institutional investors have a fair amount of stake in LATAM Airlines Group. This implies the analysts working for those institutions have looked at the stock and they like it. But just like anyone else, they could be wrong. It is not uncommon to see a big share price drop if two large institutional investors try to sell out of a stock at the same time. So it is worth checking the past earnings trajectory of LATAM Airlines Group, (below). Of course, keep in mind that there are other factors to consider, too.
LATAM Airlines Group is not owned by hedge funds. The company's largest shareholder is Lauca Investments, Llc, with ownership of 17%. The second and third largest shareholders are Delta Air Lines, Inc. and Qatar Airways Limited, with an equal amount of shares to their name at 10%.
We also observed that the top 8 shareholders account for more than half of the share register, with a few smaller shareholders to balance the interests of the larger ones to a certain extent.
While studying institutional ownership for a company can add value to your research, it is also a good practice to research analyst recommendations to get a deeper understand of a stock's expected performance. There are plenty of analysts covering the stock, so it might be worth seeing what they are forecasting, too.
Insider Ownership Of LATAM Airlines Group
The definition of an insider can differ slightly between different countries, but members of the board of directors always count. Management ultimately answers to the board. However, it is not uncommon for managers to be executive board members, especially if they are a founder or the CEO.
Most consider insider ownership a positive because it can indicate the board is well aligned with other shareholders. However, on some occasions too much power is concentrated within this group.
Our data cannot confirm that board members are holding shares personally. It is unusual not to have at least some personal holdings by board members, so our data might be flawed. A good next step would be to check how much the CEO is paid.
General Public Ownership
The general public, who are usually individual investors, hold a 31% stake in LATAM Airlines Group. While this group can't necessarily call the shots, it can certainly have a real influence on how the company is run.
Private Company Ownership
We can see that Private Companies own 31%, of the shares on issue. It might be worth looking deeper into this. If related parties, such as insiders, have an interest in one of these private companies, that should be disclosed in the annual report. Private companies may also have a strategic interest in the company.
Public Company Ownership
It appears to us that public companies own 10% of LATAM Airlines Group. It's hard to say for sure but this suggests they have entwined business interests. This might be a strategic stake, so it's worth watching this space for changes in ownership.
Next Steps:
While it is well worth considering the different groups that own a company, there are other factors that are even more important. To that end, you should be aware of the 2 warning signs we've spotted with LATAM Airlines Group .
But ultimately it is the future, not the past, that will determine how well the owners of this business will do. Therefore we think it advisable to take a look at this free report showing whether analysts are predicting a brighter future.
NB: Figures in this article are calculated using data from the last twelve months, which refer to the 12-month period ending on the last date of the month the financial statement is dated. This may not be consistent with full year annual report figures.
Have feedback on this article? Concerned about the content? Get in touch with us directly. Alternatively, email editorial-team (at) simplywallst.com.
This article by Simply Wall St is general in nature. We provide commentary based on historical data and analyst forecasts only using an unbiased methodology and our articles are not intended to be financial advice. It does not constitute a recommendation to buy or sell any stock, and does not take account of your objectives, or your financial situation. We aim to bring you long-term focused analysis driven by fundamental data. Note that our analysis may not factor in the latest price-sensitive company announcements or qualitative material. Simply Wall St has no position in any stocks mentioned.