
Public companies invested in Guotai Junan International Holdings Limited (HKG:1788) copped the brunt of last week's HK$1.3b market cap decline
Key Insights
- Guotai Junan International Holdings' significant public companies ownership suggests that the key decisions are influenced by shareholders from the larger public
- 68% of the company is held by a single shareholder (Guotai Haitong Securities Co., Ltd.)
- Ownership research, combined with past performance data can help provide a good understanding of opportunities in a stock
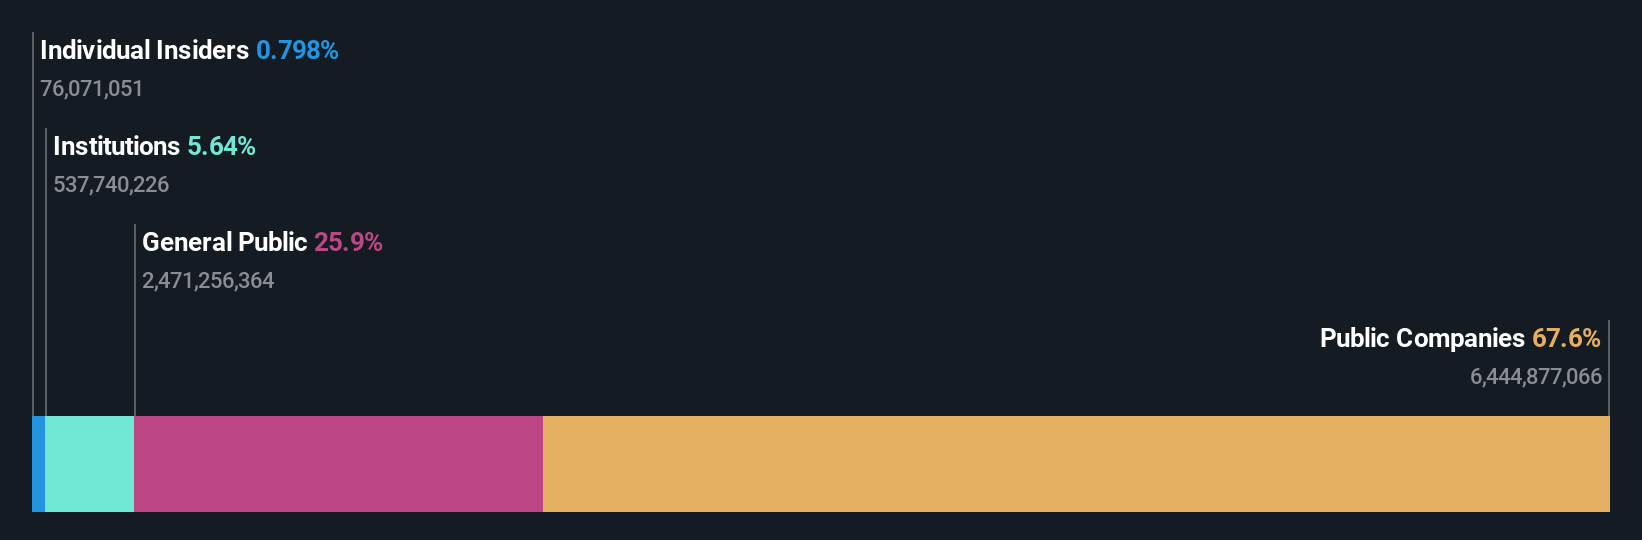
To get a sense of who is truly in control of Guotai Junan International Holdings Limited (HKG:1788), it is important to understand the ownership structure of the business. We can see that public companies own the lion's share in the company with 68% ownership. That is, the group stands to benefit the most if the stock rises (or lose the most if there is a downturn).
And last week, public companies endured the biggest losses as the stock fell by 5.1%.
In the chart below, we zoom in on the different ownership groups of Guotai Junan International Holdings.
Check out our latest analysis for Guotai Junan International Holdings
What Does The Institutional Ownership Tell Us About Guotai Junan International Holdings?
Institutions typically measure themselves against a benchmark when reporting to their own investors, so they often become more enthusiastic about a stock once it's included in a major index. We would expect most companies to have some institutions on the register, especially if they are growing.
As you can see, institutional investors have a fair amount of stake in Guotai Junan International Holdings. This can indicate that the company has a certain degree of credibility in the investment community. However, it is best to be wary of relying on the supposed validation that comes with institutional investors. They too, get it wrong sometimes. If multiple institutions change their view on a stock at the same time, you could see the share price drop fast. It's therefore worth looking at Guotai Junan International Holdings' earnings history below. Of course, the future is what really matters.

We note that hedge funds don't have a meaningful investment in Guotai Junan International Holdings. Guotai Haitong Securities Co., Ltd. is currently the largest shareholder, with 68% of shares outstanding. With such a huge stake in the ownership, we infer that they have significant control of the future of the company. With 2.5% and 1.0% of the shares outstanding respectively, UBS Asset Management AG and The Vanguard Group, Inc. are the second and third largest shareholders.
While studying institutional ownership for a company can add value to your research, it is also a good practice to research analyst recommendations to get a deeper understand of a stock's expected performance. There is a little analyst coverage of the stock, but not much. So there is room for it to gain more coverage.
Insider Ownership Of Guotai Junan International Holdings
The definition of an insider can differ slightly between different countries, but members of the board of directors always count. Management ultimately answers to the board. However, it is not uncommon for managers to be executive board members, especially if they are a founder or the CEO.
Most consider insider ownership a positive because it can indicate the board is well aligned with other shareholders. However, on some occasions too much power is concentrated within this group.
Our most recent data indicates that insiders own less than 1% of Guotai Junan International Holdings Limited. It's a big company, so even a small proportional interest can create alignment between the board and shareholders. In this case insiders own HK$196m worth of shares. It is always good to see at least some insider ownership, but it might be worth checking if those insiders have been selling.
General Public Ownership
The general public, who are usually individual investors, hold a 26% stake in Guotai Junan International Holdings. While this size of ownership may not be enough to sway a policy decision in their favour, they can still make a collective impact on company policies.
Public Company Ownership
It appears to us that public companies own 68% of Guotai Junan International Holdings. We can't be certain but it is quite possible this is a strategic stake. The businesses may be similar, or work together.
Next Steps:
I find it very interesting to look at who exactly owns a company. But to truly gain insight, we need to consider other information, too. For example, we've discovered 2 warning signs for Guotai Junan International Holdings (1 is concerning!) that you should be aware of before investing here.
If you would prefer discover what analysts are predicting in terms of future growth, do not miss this free report on analyst forecasts.
NB: Figures in this article are calculated using data from the last twelve months, which refer to the 12-month period ending on the last date of the month the financial statement is dated. This may not be consistent with full year annual report figures.
Have feedback on this article? Concerned about the content? Get in touch with us directly. Alternatively, email editorial-team (at) simplywallst.com.
This article by Simply Wall St is general in nature. We provide commentary based on historical data and analyst forecasts only using an unbiased methodology and our articles are not intended to be financial advice. It does not constitute a recommendation to buy or sell any stock, and does not take account of your objectives, or your financial situation. We aim to bring you long-term focused analysis driven by fundamental data. Note that our analysis may not factor in the latest price-sensitive company announcements or qualitative material. Simply Wall St has no position in any stocks mentioned.