
Has Flex’s 301% Three Year Surge Left Its Shares Priced For Perfection In 2025?
- If you are wondering whether Flex is still attractive after such a huge run, or if you may be late to the party, this breakdown will help you assess whether the current price still makes sense.
- The stock has surged 17.6% over the last week, is up 7.8% in the past month, and has risen 74.9% year to date, with a 78.1% gain over the last year and 301.1% over three years, which has clearly changed how the market views its potential.
- Recently, investors have been reacting to Flex’s role in secular trends like supply chain diversification and electronics manufacturing, as large customers look for resilient, scalable partners. The company’s positioning in areas such as cloud infrastructure hardware, automotive electronics, and broader industrial solutions has kept it in the conversation whenever markets discuss reshoring, AI related hardware demand, and long term manufacturing shifts.
- Even after that run, Flex only scores 2 out of 6 on our undervaluation checks, which suggests the market may already be pricing in a lot of good news. However, as we walk through different valuation approaches and a more narrative driven framework later on, you will see there is a more structured way to judge whether the current price tag is justified.
Flex scores just 2/6 on our valuation checks. See what other red flags we found in the full valuation breakdown.
Approach 1: Flex Discounted Cash Flow (DCF) Analysis
A Discounted Cash Flow model estimates what a company is worth by projecting its future cash flows and then discounting them back to today, using a required rate of return.
For Flex, the latest twelve month Free Cash Flow is about $1.17 billion. Analysts and extrapolations used in the 2 Stage Free Cash Flow to Equity model see this rising to roughly $1.92 billion by 2035, with intermediate projections such as $1.35 billion in 2028. Simply Wall St uses analyst estimates where available, then extrapolates further growth beyond that horizon.
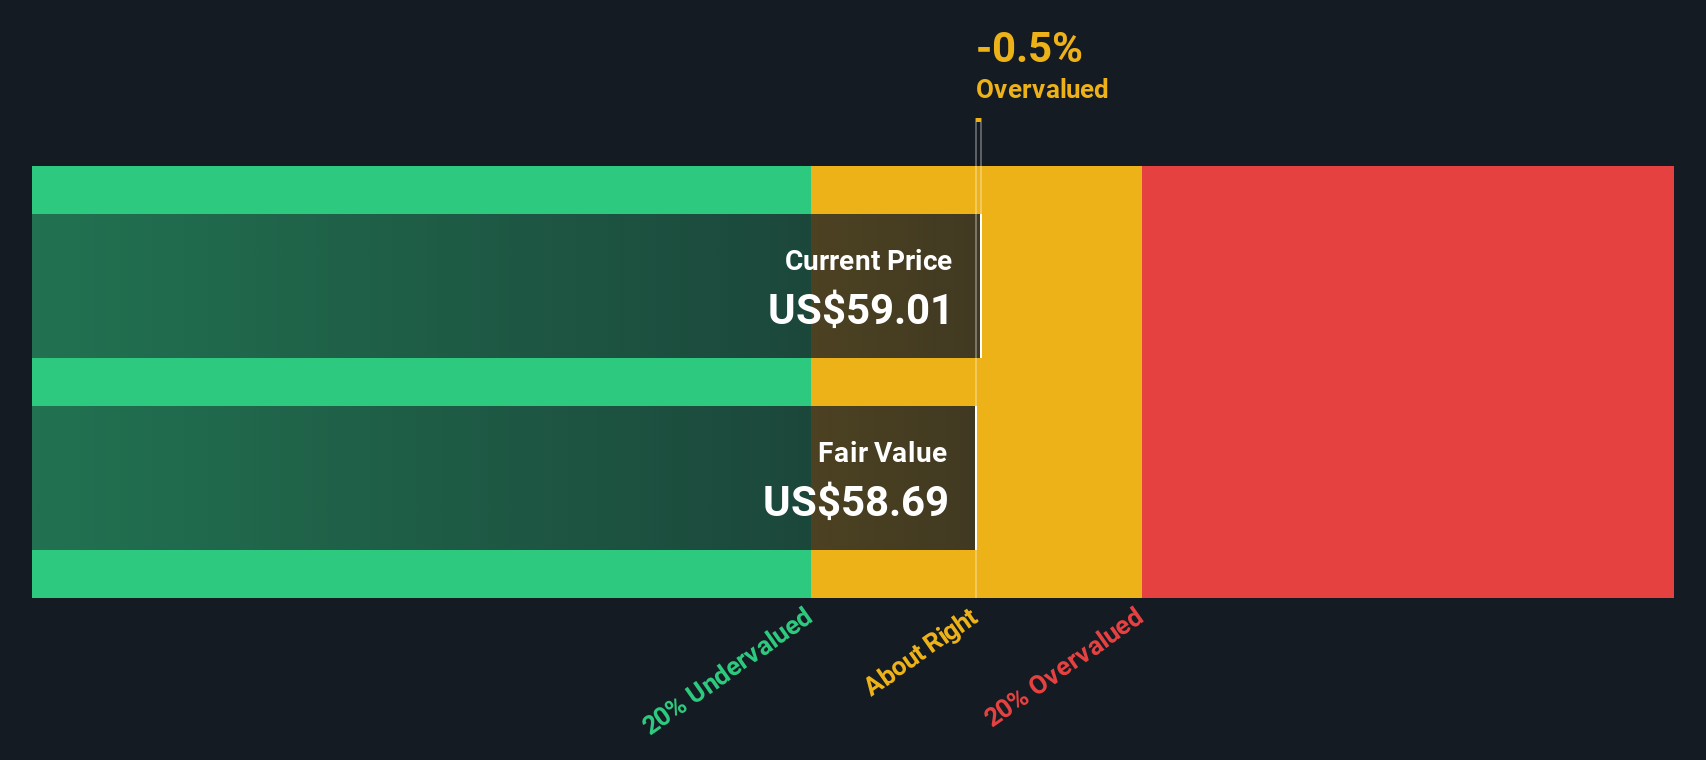
Bringing all those projected cash flows back to today gives an estimated intrinsic value of about $65.53 per share. Compared with the current share price, the DCF suggests Flex is roughly 3.1% overvalued, so the market price is only slightly ahead of the modelled fair value.
Result: ABOUT RIGHT
Flex is fairly valued according to our Discounted Cash Flow (DCF), but this can change at a moment's notice. Track the value in your watchlist or portfolio and be alerted on when to act.
Approach 2: Flex Price vs Earnings
For profitable companies like Flex, the Price to Earnings ratio is a useful way to gauge how much investors are willing to pay today for each dollar of current earnings. It naturally ties valuation to profitability, which is what ultimately supports long term returns.
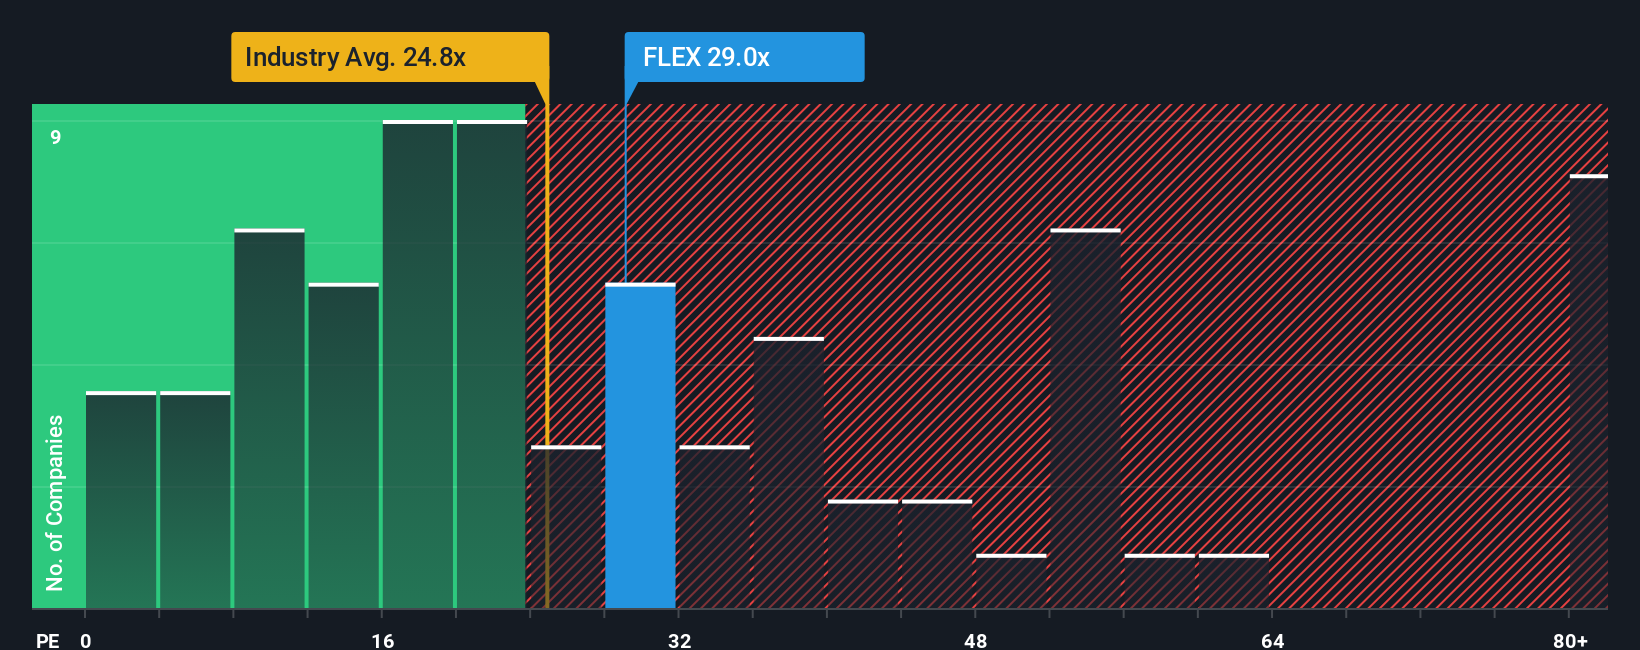
What counts as a fair PE depends on how quickly earnings are expected to grow and how risky those earnings are. Higher growth and more resilient profits can justify a higher multiple, while slower or less certain growth typically deserves a lower one. Flex currently trades on a PE of about 28.5x. That is above the broader Electronic industry average of roughly 24.7x, but below the peer group average of around 40.0x. This suggests the market is assigning it a premium to the sector, but not a top tier growth multiple.
Simply Wall St’s Fair Ratio is a proprietary estimate of what Flex’s PE should be, based on its earnings growth, margins, risk profile, industry, and market cap. This is more tailored than simple peer or industry comparisons, which can be distorted by outliers or very different business models. Flex’s Fair Ratio is calculated at about 32.0x, modestly above the current 28.5x, which implies the shares are trading at a slight discount to what its fundamentals would justify.
Result: UNDERVALUED
PE ratios tell one story, but what if the real opportunity lies elsewhere? Discover 1450 companies where insiders are betting big on explosive growth.
Upgrade Your Decision Making: Choose your Flex Narrative
Earlier we mentioned that there is an even better way to understand valuation, so let us introduce you to Narratives. These are simply your own story about a company, linked directly to a set of numbers like future revenue, earnings, margins, and a fair value estimate, and made available as an easy tool on Simply Wall St’s Community page where millions of investors share how they see a stock evolving.
A Narrative connects three things in one place: what you believe will shape a company’s future, how that belief translates into a financial forecast, and the fair value those forecasts imply, so you can quickly see whether your view suggests a stock is worth more or less than today’s market price.
Because Narratives on Simply Wall St automatically update as fresh news, earnings, or guidance arrive, they can help you decide whether to buy, hold, or sell by continually comparing your evolving fair value to the current price. You can see this in action with Flex, where some investors lean toward a more cautious view close to the lower analyst target of $50, while others build in stronger AI driven growth closer to $75. This leads to very different but clearly explained buy or wait decisions.
Do you think there's more to the story for Flex? Head over to our Community to see what others are saying!

This article by Simply Wall St is general in nature. We provide commentary based on historical data and analyst forecasts only using an unbiased methodology and our articles are not intended to be financial advice. It does not constitute a recommendation to buy or sell any stock, and does not take account of your objectives, or your financial situation. We aim to bring you long-term focused analysis driven by fundamental data. Note that our analysis may not factor in the latest price-sensitive company announcements or qualitative material. Simply Wall St has no position in any stocks mentioned.
Have feedback on this article? Concerned about the content? Get in touch with us directly. Alternatively, email editorial-team@simplywallst.com