
Is Snowflake’s Recent Pullback Creating a Fresh Opportunity in 2025?
- Wondering if Snowflake is still worth buying after its run up and recent wobble, or if the smart money has already moved on? You are not alone, and that is exactly what we are going to unpack here.
- Despite a strong longer term picture with the stock up 43.0% year to date and 31.3% over the last year, the recent pullback of 13.2% over 7 days and 14.3% over 30 days has reset expectations and opened up fresh questions about risk and reward.
- Those swings have come as investors digest a wave of AI and data infrastructure enthusiasm, plus shifting sentiment around high growth software names, which has made Snowflake a lightning rod for debates about what scalable, cloud native data platforms should be worth. At the same time, the stock is being pulled between longer term optimism about data growth and near term caution around spending cycles, which helps explain the sharp moves.
- On our simple valuation checks, Snowflake scores just 1 out of 6, which suggests that on the surface it does not screen as obviously undervalued. However, headline checks are only part of the story. Next we will walk through the main valuation approaches and then finish with a more nuanced way to think about what Snowflake might really be worth.
Snowflake scores just 1/6 on our valuation checks. See what other red flags we found in the full valuation breakdown.
Approach 1: Snowflake Discounted Cash Flow (DCF) Analysis
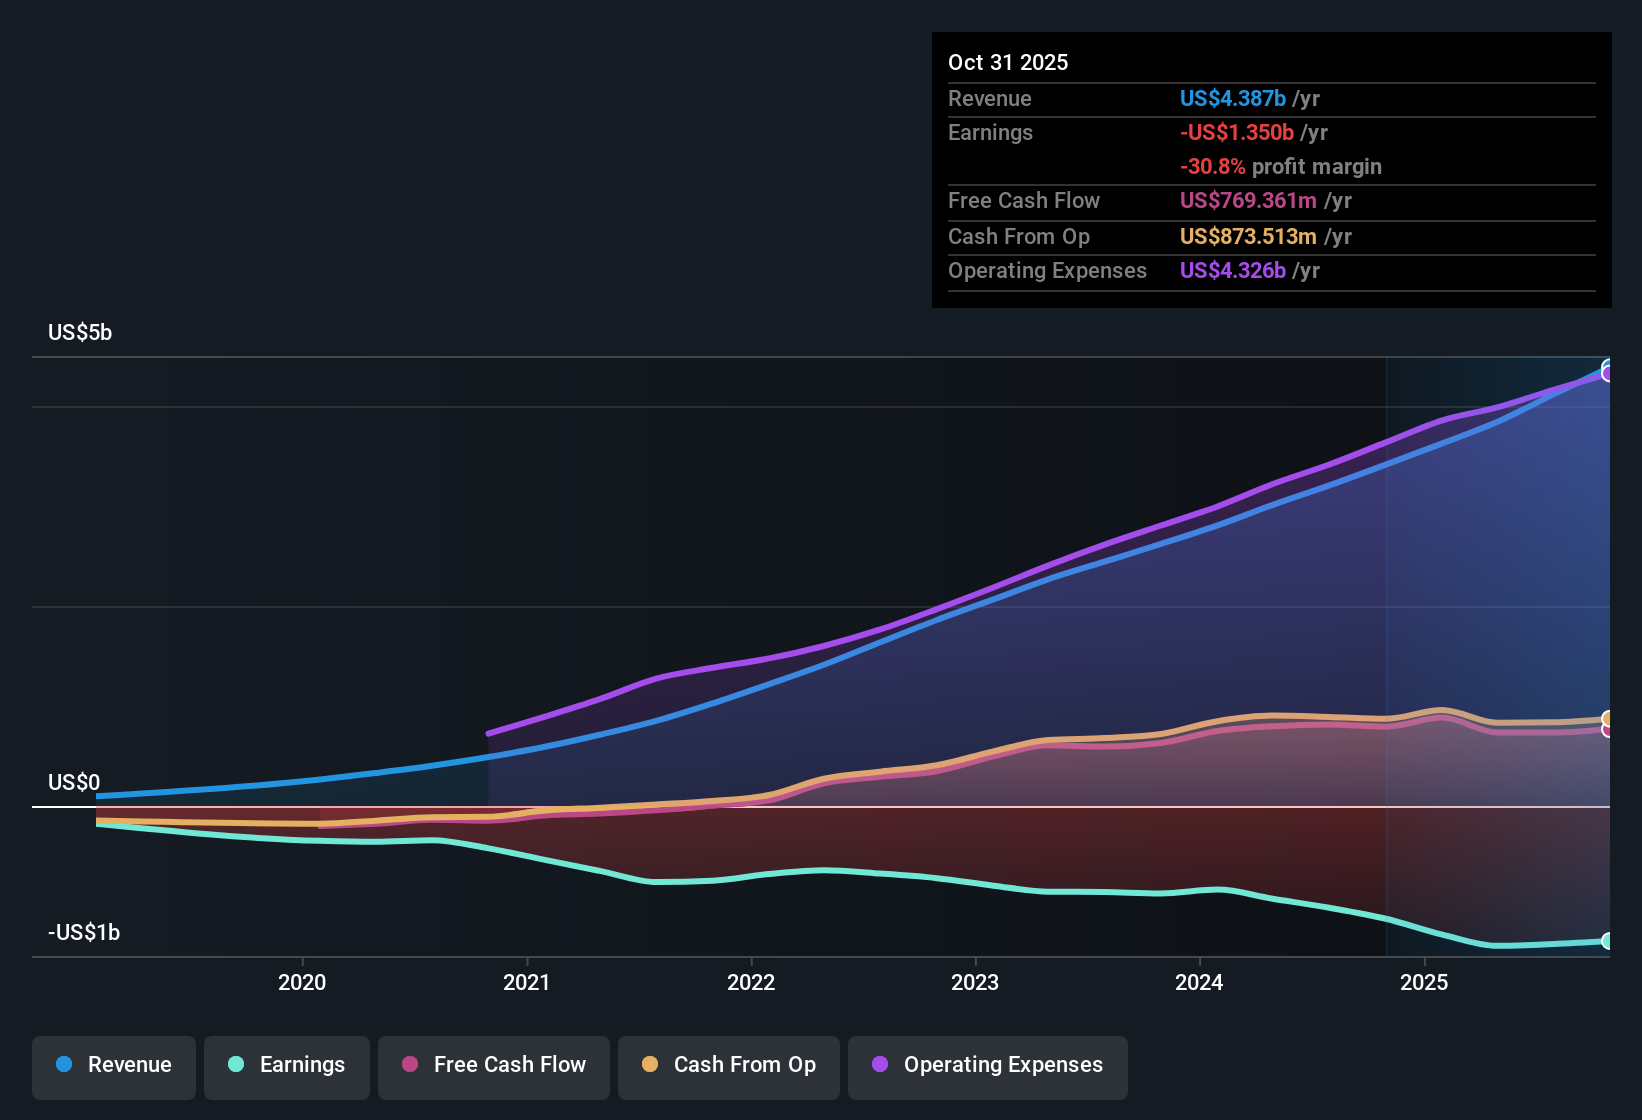
A Discounted Cash Flow, or DCF, model estimates what a company is worth by projecting the cash it can generate in the future and discounting those cash flows back to today in dollar terms. For Snowflake, the model used is a 2 Stage Free Cash Flow to Equity approach, starting from last twelve month free cash flow of about $759 Million.
Analysts provide detailed forecasts for the next few years, and Simply Wall St then extrapolates beyond that. Under these assumptions, Snowflake’s free cash flow is projected to rise to roughly $3.07 Billion by 2030, with intermediate years steadily climbing as the business scales.
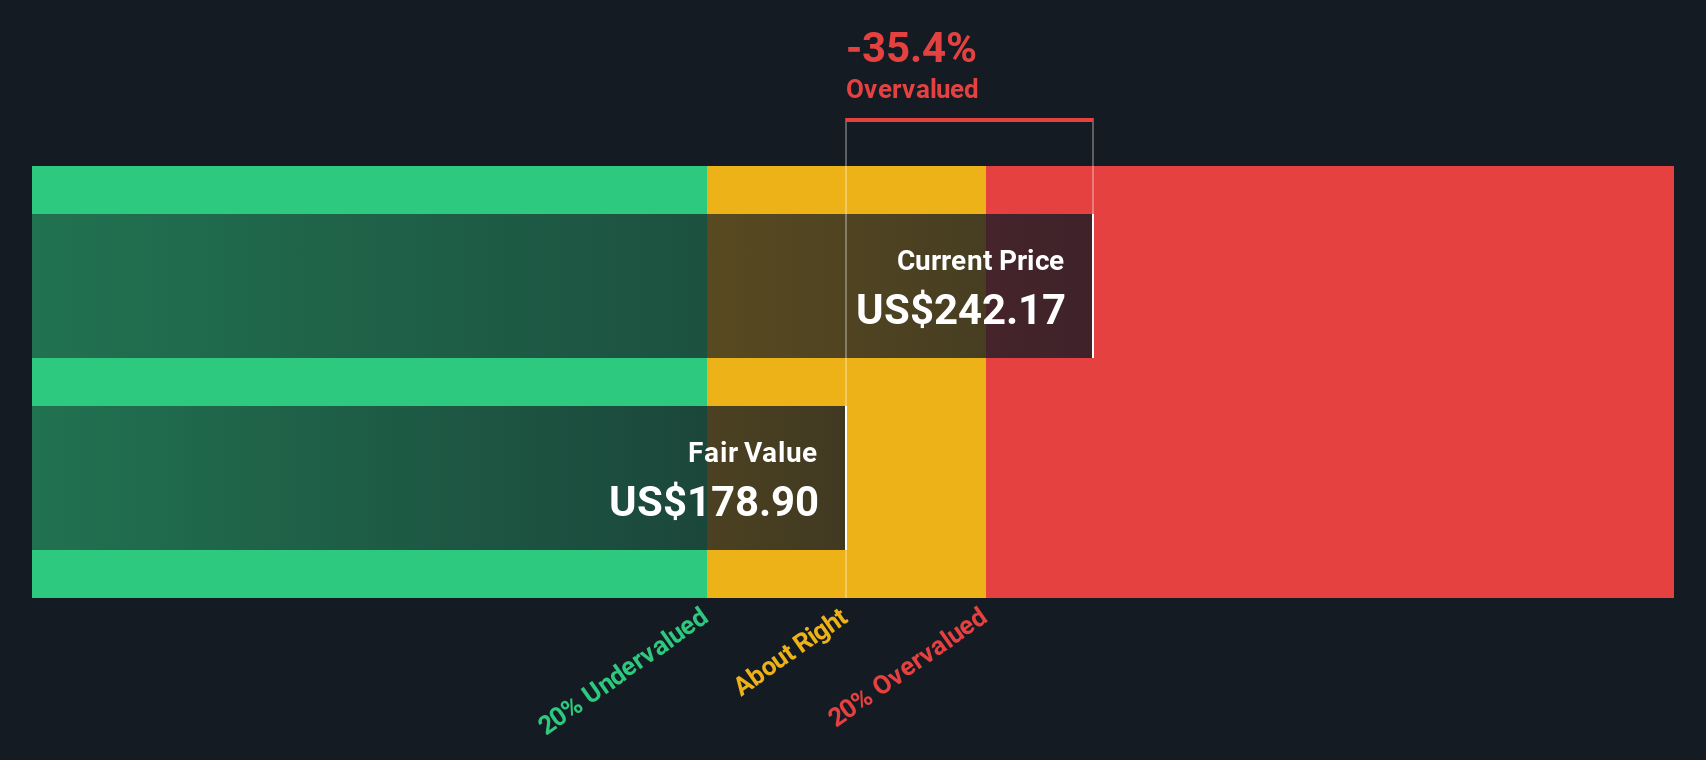
When all these projected cash flows are discounted back to today, the model arrives at an estimated intrinsic value of about $163.48 per share. Based on the implied 37.8% overvaluation from this DCF, the current share price is described as being well above what these cash flow projections would justify, even allowing for strong growth.
Result: OVERVALUED
Our Discounted Cash Flow (DCF) analysis suggests Snowflake may be overvalued by 37.8%. Discover 905 undervalued stocks or create your own screener to find better value opportunities.
Approach 2: Snowflake Price vs Sales
For high growth, still scaling software businesses like Snowflake that are not yet consistently profitable, Price to Sales is often the cleanest yardstick because it focuses on revenue traction rather than volatile or negative earnings.
In general, investors are willing to pay a higher sales multiple for companies with faster and more durable growth, stronger competitive positions and lower perceived risk. Slower growth or higher uncertainty usually pulls that “normal” multiple down.
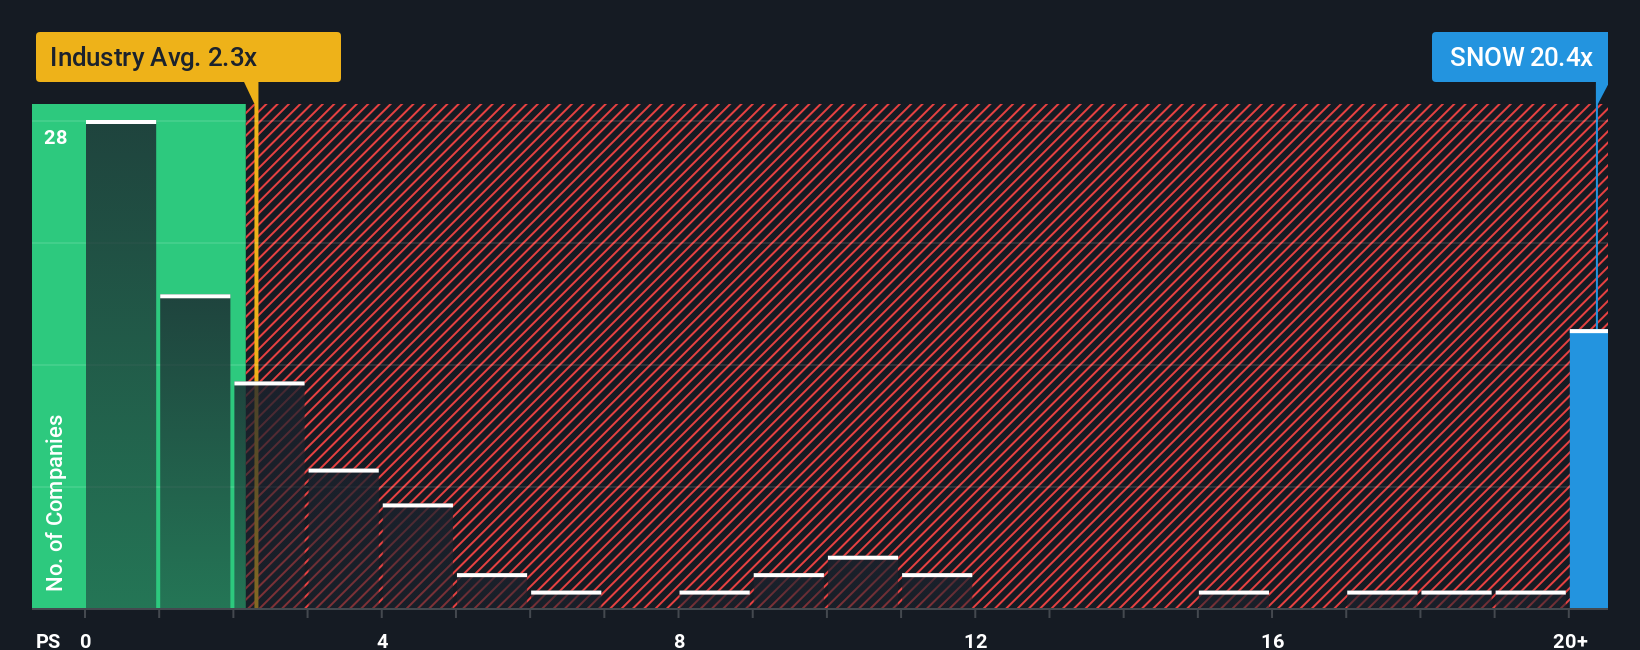
Snowflake currently trades at about 17.58x sales. That is far above the broader IT industry average of roughly 2.67x, but actually below the peer group average near 21.03x, which reflects how richly high growth data and AI infrastructure names are priced.
Simply Wall St’s Fair Ratio framework goes a step further by estimating what sales multiple Snowflake should command given its specific growth outlook, profitability profile, industry, market cap and risk factors. This produces a Fair Ratio of about 12.69x, which is a more tailored benchmark than broad peer or industry comparisons.
Set against that Fair Ratio, Snowflake’s current 17.58x sales suggests the shares are still pricing in more growth and execution than the fundamentals fully support.
Result: OVERVALUED
PS ratios tell one story, but what if the real opportunity lies elsewhere? Discover 1450 companies where insiders are betting big on explosive growth.
Upgrade Your Decision Making: Choose your Snowflake Narrative
Earlier we mentioned that there is an even better way to understand valuation, so let us introduce you to Narratives. These are simply clear, written stories that connect your view of a company like Snowflake to specific assumptions about its future revenue, earnings and margins, and then translate that story into a fair value you can compare with today’s share price.
On Simply Wall St’s Community page, millions of investors use Narratives as an easy, accessible tool to spell out what they believe will drive Snowflake’s business. They can plug those beliefs into a structured forecast and instantly see whether their implied fair value suggests the stock is a buy, a hold or a sell.
Because Narratives are updated dynamically when new information arrives, such as earnings, product launches or major AI partnerships, your fair value view automatically evolves with the latest data instead of going stale.
For example, one Snowflake Narrative might assume strong, AI driven demand and justify a fair value closer to the bullish 440.0 price target. A more cautious Narrative might focus on competitive risks and slower monetization, landing nearer the bearish 170.0 target. The platform lets you see, compare and track both perspectives side by side.
Do you think there's more to the story for Snowflake? Head over to our Community to see what others are saying!
This article by Simply Wall St is general in nature. We provide commentary based on historical data and analyst forecasts only using an unbiased methodology and our articles are not intended to be financial advice. It does not constitute a recommendation to buy or sell any stock, and does not take account of your objectives, or your financial situation. We aim to bring you long-term focused analysis driven by fundamental data. Note that our analysis may not factor in the latest price-sensitive company announcements or qualitative material. Simply Wall St has no position in any stocks mentioned.
Have feedback on this article? Concerned about the content? Get in touch with us directly. Alternatively, email editorial-team@simplywallst.com