
Is It Too Late To Consider F5 After Its Recent Share Price Surge?
- If you are wondering whether F5 at around $257 a share is still worth considering after its big run, or if you have missed the boat, this is a good place to unpack what the current price implies.
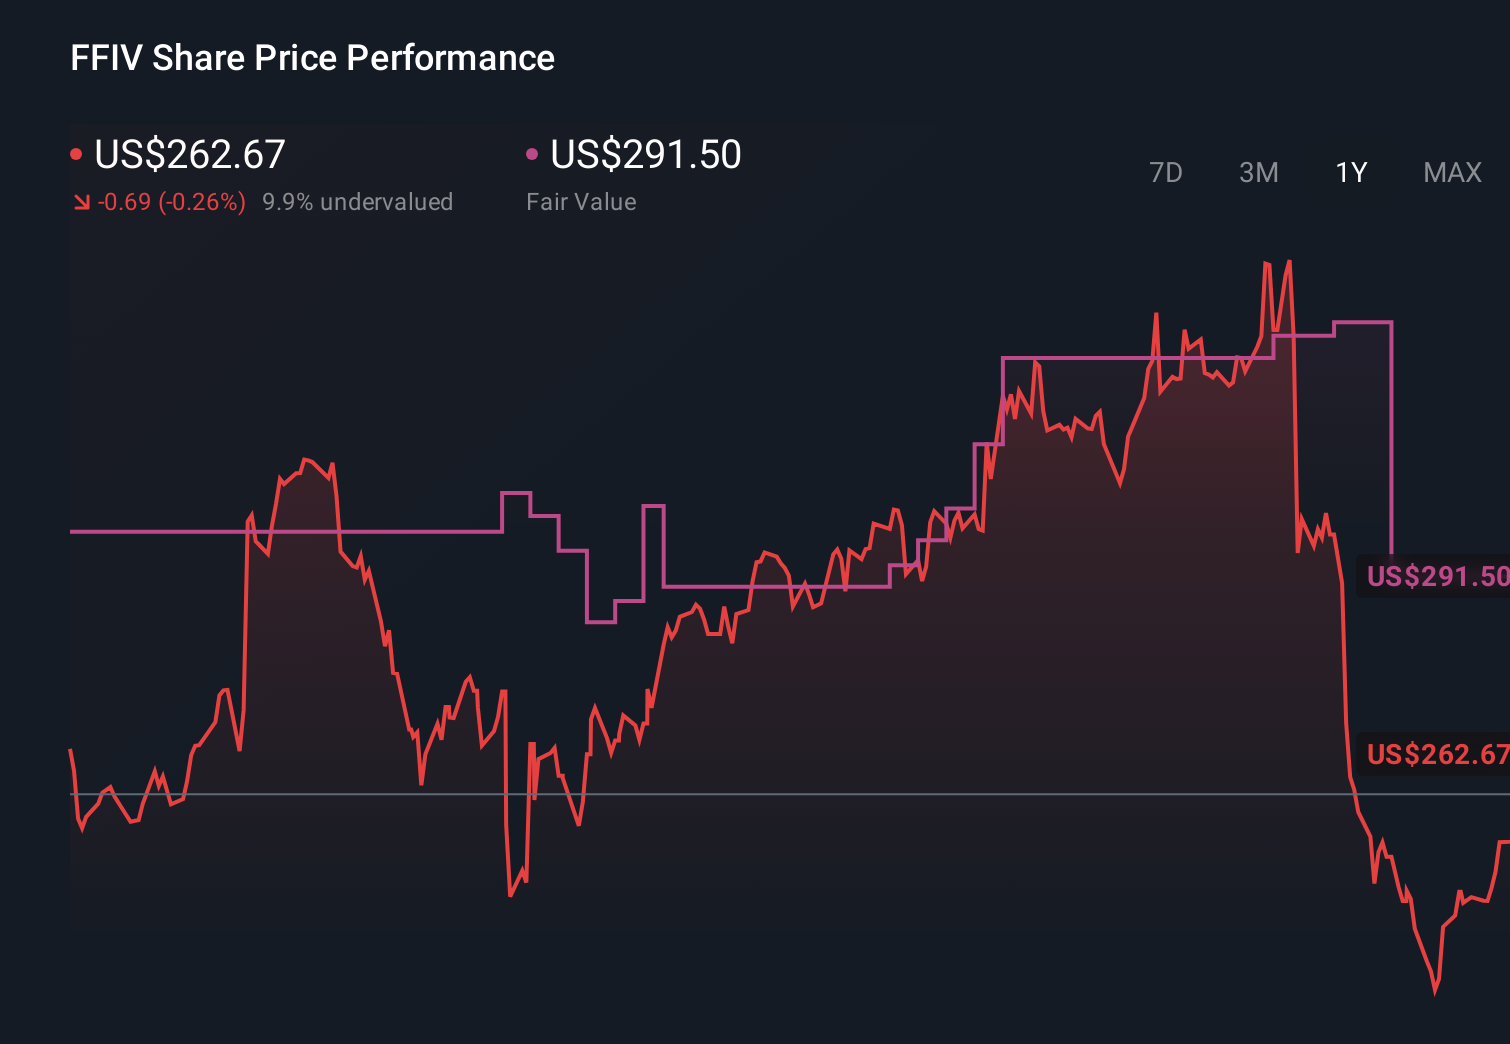
- Over the last week the stock is up 8.2%, adding to a 5.0% gain over 30 days and a 66.9% rise over three years, even though the 1 year return is only 0.9% and the move year to date is 2.5%.
- That uneven performance has played out alongside a steady sequence of product and strategy updates, from F5 doubling down on application security and multi cloud networking to expanding automation tools for large enterprise customers. Together, these moves have helped investors reassess its long term role in securing and managing increasingly complex app environments.
- On our scorecard F5 records a valuation score of 5/6, meaning it screens as undervalued on five of six checks. Next, we walk through what that looks like under different valuation lenses and why there may be an even more useful way to judge value than traditional models alone.
Find out why F5's 0.9% return over the last year is lagging behind its peers.
Approach 1: F5 Discounted Cash Flow (DCF) Analysis
A Discounted Cash Flow model estimates what a company is worth by projecting its future cash flows and then discounting them back to today, using a required rate of return. For F5, the model starts with last twelve months Free Cash Flow of about $904 million and factors in analyst forecasts for the next few years, then extends those trends further into the future.
On this basis, Simply Wall St projects F5 to be generating around $1.21 billion in Free Cash Flow by 2035, with the intermediate years gradually stepping up from the current level. All cash flows are assessed in $, even if the reporting currency differs. Those future cash flows are then discounted back to today using a 2 Stage Free Cash Flow to Equity framework, which captures a nearer term growth phase and a more stable long term phase.
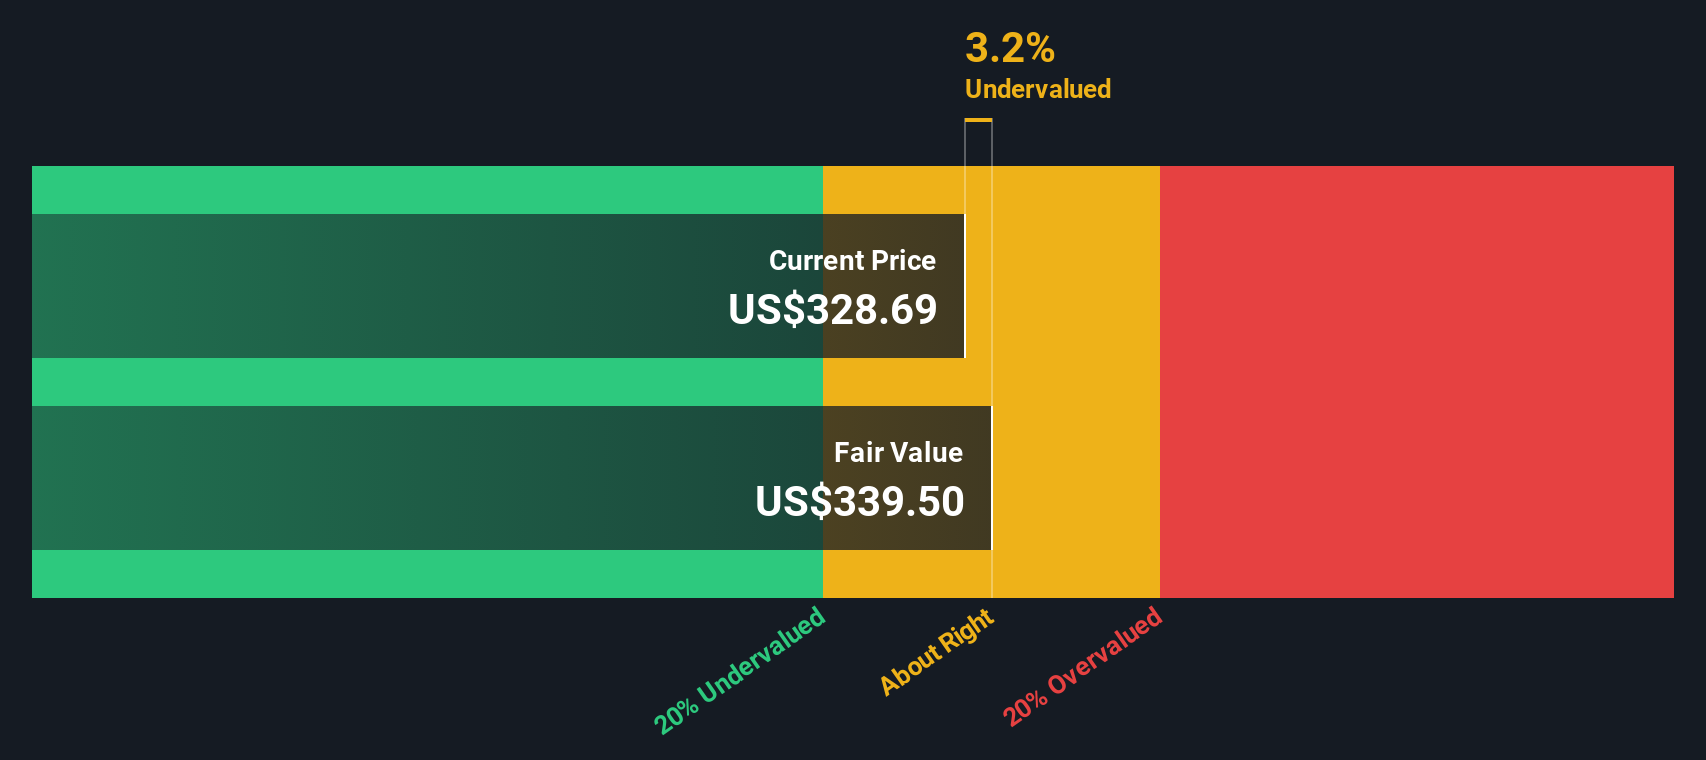
The result is an estimated intrinsic value of roughly $316 per share, compared with a current share price of about $257, implying the stock is trading at an 18.3% discount to its DCF based value.
Result: UNDERVALUED (based on this model)
Our Discounted Cash Flow (DCF) analysis suggests F5 is undervalued by 18.3%. Track this in your watchlist or portfolio, or discover 905 more undervalued stocks based on cash flows.
Approach 2: F5 Price vs Earnings
For consistently profitable companies like F5, the Price to Earnings, or PE, ratio is a practical way to gauge value because it links what investors pay directly to the earnings the business is generating today. In general, faster growing and lower risk companies deserve higher PE ratios, while slower growth or higher uncertainty should translate into lower multiples.
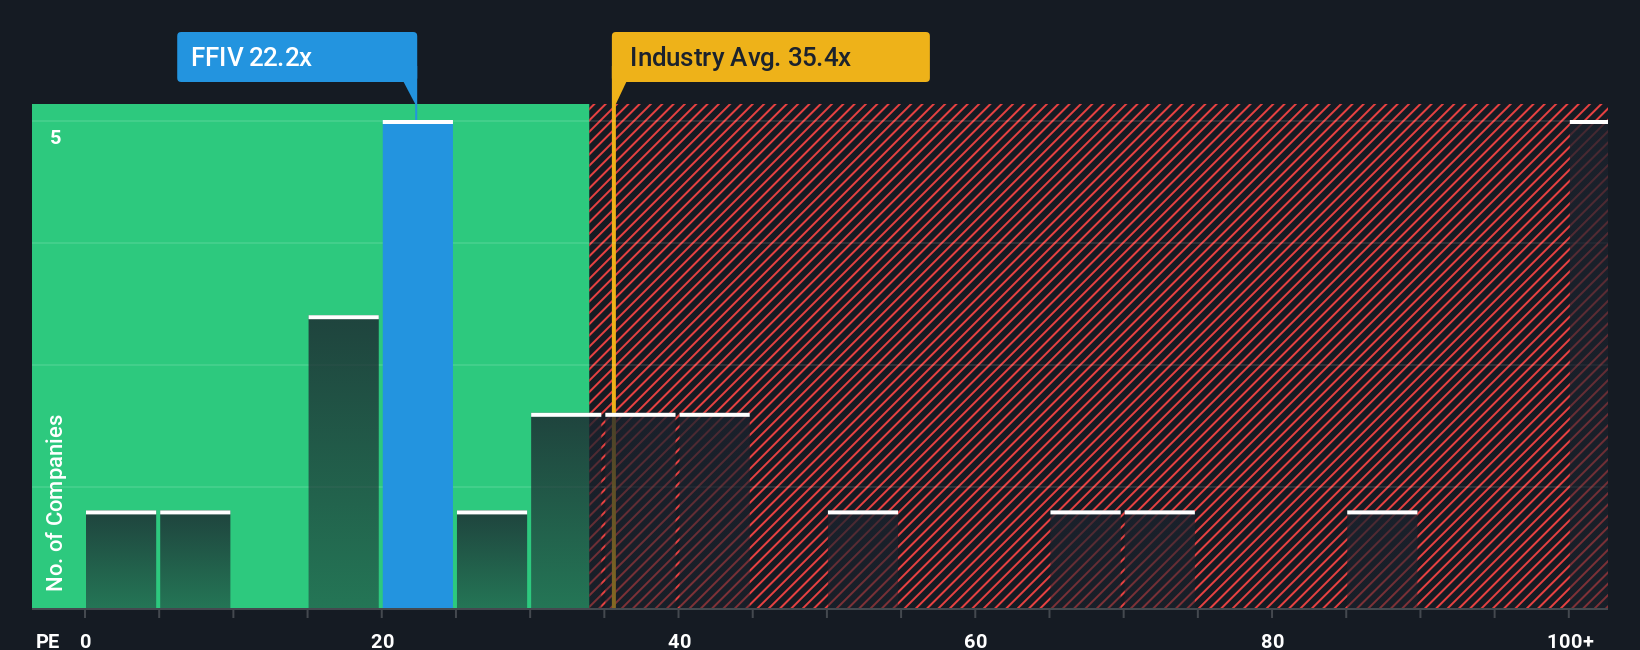
F5 currently trades on a PE of about 21.6x, which is below both the broader communications industry average of roughly 33.1x and the peer group average of around 27.7x. Simply Wall St also calculates a Fair Ratio of 23.4x, which reflects what investors might reasonably pay for F5 given its earnings growth outlook, margins, size, industry and risk profile.
This Fair Ratio is more tailored than a simple comparison to peers or the sector because it adjusts for company specific strengths and risks rather than assuming all firms deserve the same multiple. With F5’s actual PE sitting a little below its Fair Ratio, the shares look modestly undervalued on this earnings based lens.
Result: UNDERVALUED
PE ratios tell one story, but what if the real opportunity lies elsewhere? Discover 1450 companies where insiders are betting big on explosive growth.
Upgrade Your Decision Making: Choose your F5 Narrative
Earlier we mentioned that there is an even better way to understand valuation, so let us introduce you to Narratives, a simple framework on Simply Wall St’s Community page that lets you connect your view of a company’s story to a concrete financial forecast and a Fair Value you can compare with today’s price. A Narrative starts with your perspective on the business, then ties that story to assumptions for future revenue, earnings and margins, and finally turns those assumptions into an estimated Fair Value that updates dynamically as new news, earnings or guidance arrives. This makes Narratives an accessible, numbers backed way to think about your decisions by continually contrasting your Fair Value with the live market price. For F5, for example, one investor might build a bullish Narrative closer to $390 per share based on accelerating hybrid cloud and AI security demand, while another might anchor around $260, emphasizing security breach risks and slower software adoption, and Narratives helps you see exactly which assumptions separate those views and where your own conviction sits between them.
Do you think there's more to the story for F5? Head over to our Community to see what others are saying!
This article by Simply Wall St is general in nature. We provide commentary based on historical data and analyst forecasts only using an unbiased methodology and our articles are not intended to be financial advice. It does not constitute a recommendation to buy or sell any stock, and does not take account of your objectives, or your financial situation. We aim to bring you long-term focused analysis driven by fundamental data. Note that our analysis may not factor in the latest price-sensitive company announcements or qualitative material. Simply Wall St has no position in any stocks mentioned.
Have feedback on this article? Concerned about the content? Get in touch with us directly. Alternatively, email editorial-team@simplywallst.com