
Has Honeywell’s Recent Share Price Slide Created a Long Term Opportunity in 2025?
- Wondering if Honeywell International is starting to look like a bargain, or if the recent dip is just a value trap in disguise? This breakdown will help you decide with a clear, valuation-first lens.
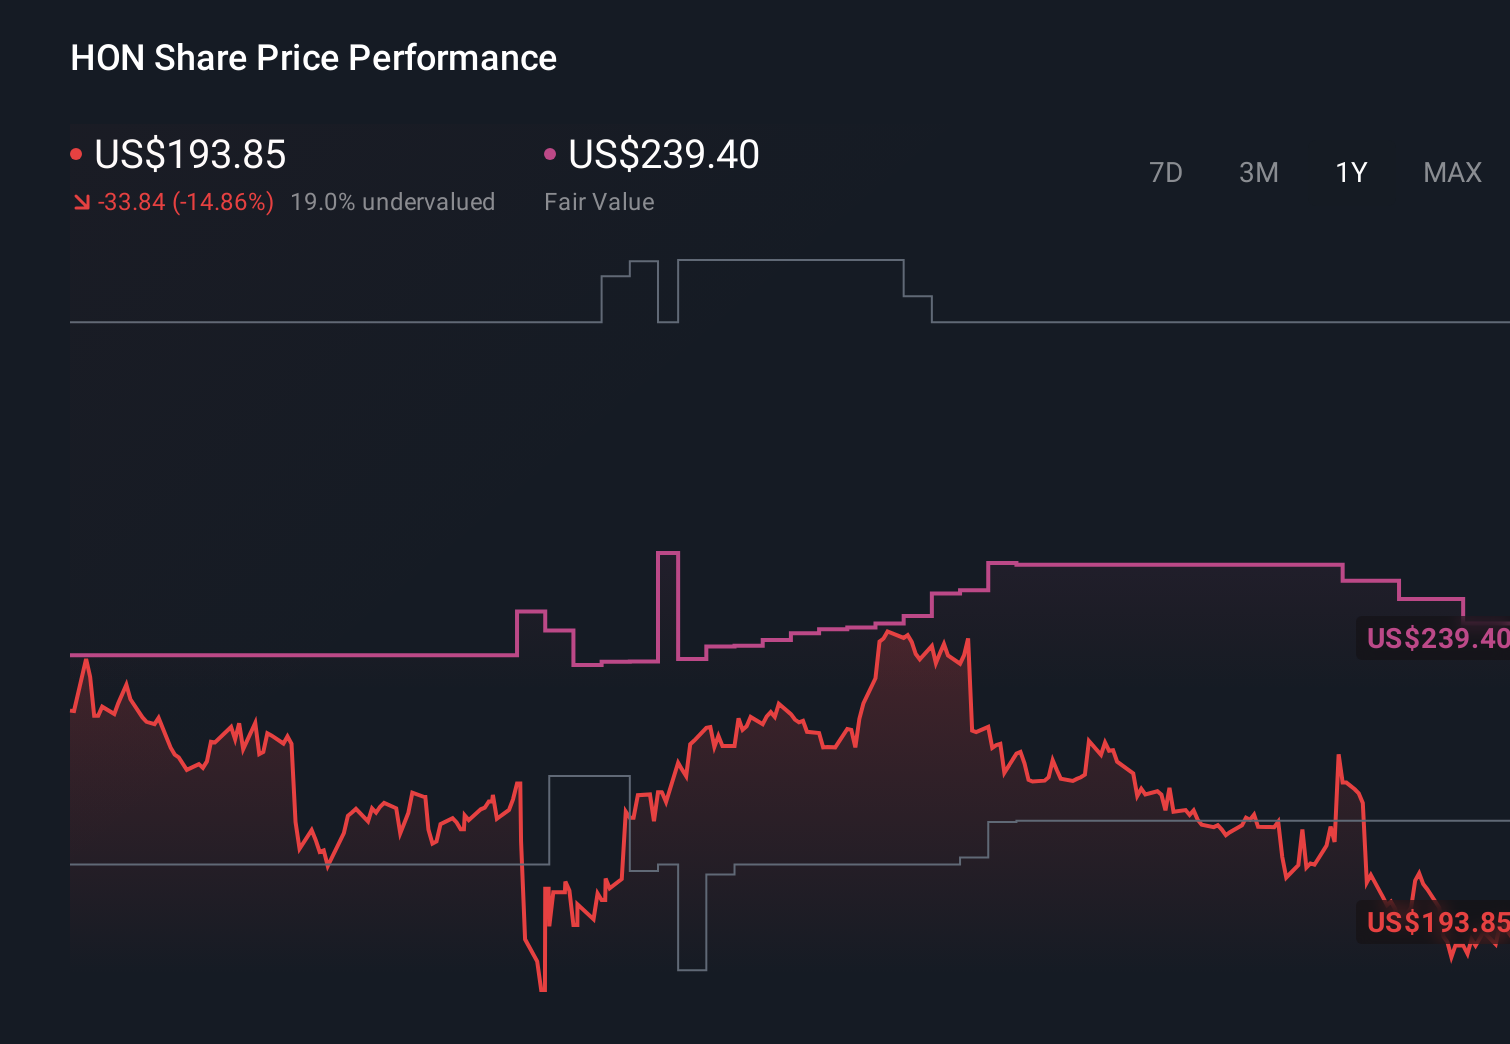
- The stock is trading around $190.17 after sliding about 1.5% over the last week and roughly 2.0% over the past month, adding to a year-to-date decline of about 15.7% and a 10.0% drop over the last year.
- Those softer returns come as investors reassess industrial names amid shifting interest rate expectations and a more cautious macro outlook, especially for capital goods and automation spending. At the same time, Honeywell has stayed active on portfolio moves and strategic investments, which keeps the long-term narrative more resilient than the recent share price performance might suggest.
- On our checklist-based valuation framework, Honeywell scores a 4/6 valuation score, suggesting pockets of undervaluation but not a slam dunk. Next, we will unpack what different valuation methods say about that score before circling back to an even more insightful way to think about the company’s true worth.
Find out why Honeywell International's -10.0% return over the last year is lagging behind its peers.
Approach 1: Honeywell International Discounted Cash Flow (DCF) Analysis
A Discounted Cash Flow model takes Honeywell International’s expected future cash flows and then discounts them back into today’s dollars to estimate what the business is worth right now.
Honeywell generated around $6.3 billion in Free Cash Flow (FCF) over the last twelve months. Analysts and model assumptions then project cash flows growing modestly over time, reaching roughly $9.1 billion by 2035. The first few years of this path are based on analyst estimates, while the later years are extrapolated using Simply Wall St’s 2 Stage Free Cash Flow to Equity framework.
Putting those projected cash flows together and discounting them back to today gives an estimated intrinsic value of about $222.67 per share. Versus the current share price around $190, the model implies the stock is roughly 14.6% undervalued, suggesting investors are not fully pricing in Honeywell’s cash generation profile.
Result: UNDERVALUED
Our Discounted Cash Flow (DCF) analysis suggests Honeywell International is undervalued by 14.6%. Track this in your watchlist or portfolio, or discover 906 more undervalued stocks based on cash flows.

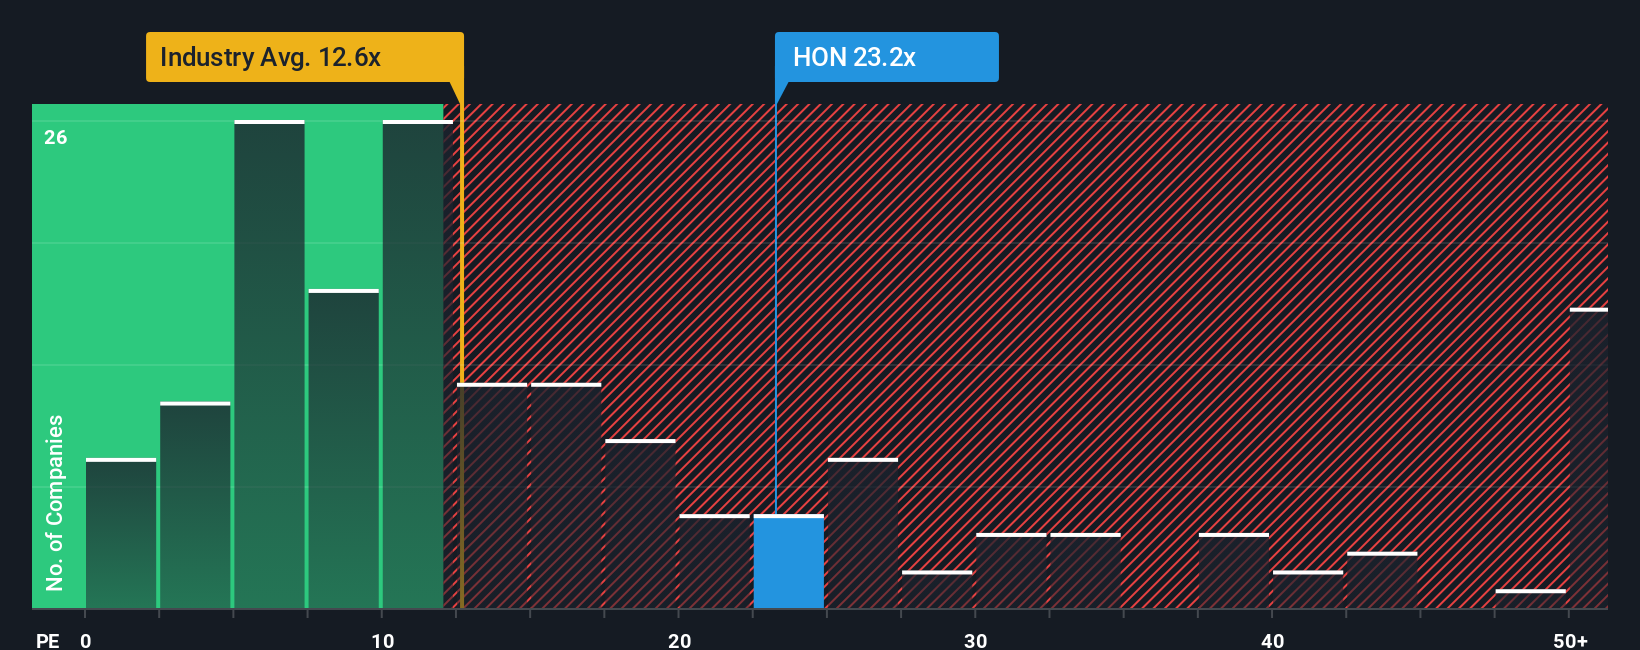
Approach 2: Honeywell International Price vs Earnings
For a mature, consistently profitable business like Honeywell, the Price to Earnings (PE) ratio is a natural yardstick because it directly links what investors pay to the company’s current earnings power. In general, faster earnings growth and lower perceived risk justify a higher PE multiple, while slower growth or higher uncertainty should pull that multiple down.
Honeywell currently trades on a PE of about 19.7x, which is well above the broader Industrials sector average of roughly 12.4x but below the peer group average near 28.8x. To refine that comparison, Simply Wall St uses a proprietary “Fair Ratio,” which estimates what PE you would expect for Honeywell after accounting for its earnings growth profile, margins, industry, market cap and risk factors. For Honeywell, that Fair Ratio is 27.4x, implying the market is assigning a material discount relative to what those fundamentals might warrant.
Because the Fair Ratio is tailored to Honeywell’s specific strengths and risks rather than broad sector snapshots, it is a more nuanced benchmark than simple peer or industry averages. With the actual PE at 19.7x versus a Fair Ratio of 27.4x, the multiple-based view points to undervaluation rather than exuberance.
Result: UNDERVALUED
PE ratios tell one story, but what if the real opportunity lies elsewhere? Discover 1450 companies where insiders are betting big on explosive growth.
Upgrade Your Decision Making: Choose your Honeywell International Narrative
Earlier we mentioned that there is an even better way to understand valuation, so let us introduce you to Narratives, which are simply your story about a company, tied directly to your assumptions about its future revenue, earnings, margins and ultimately what you think it is worth today.
With a Narrative, you connect the dots from business story, to financial forecast, to Fair Value, then compare that Fair Value to the current share price to decide whether Honeywell belongs on your buy, hold, or sell list.
Narratives are easy to use on Simply Wall St, inside the Community page that millions of investors already visit, and they automatically update as new information like earnings, news or guidance changes your forecast and valuation.
For Honeywell, for example, one Narrative might lean bullish around a breakup unlocking upside and justify a Fair Value near $290, while a more cautious Narrative could focus on tariff and separation risks and land closer to $203. Your role as an investor is to decide which story, and which Fair Value, best fits your view of the company.
Do you think there's more to the story for Honeywell International? Head over to our Community to see what others are saying!
This article by Simply Wall St is general in nature. We provide commentary based on historical data and analyst forecasts only using an unbiased methodology and our articles are not intended to be financial advice. It does not constitute a recommendation to buy or sell any stock, and does not take account of your objectives, or your financial situation. We aim to bring you long-term focused analysis driven by fundamental data. Note that our analysis may not factor in the latest price-sensitive company announcements or qualitative material. Simply Wall St has no position in any stocks mentioned.
Have feedback on this article? Concerned about the content? Get in touch with us directly. Alternatively, email editorial-team@simplywallst.com