
We Think SK Square (KRX:402340) Can Stay On Top Of Its Debt
Howard Marks put it nicely when he said that, rather than worrying about share price volatility, 'The possibility of permanent loss is the risk I worry about... and every practical investor I know worries about.' It's only natural to consider a company's balance sheet when you examine how risky it is, since debt is often involved when a business collapses. Importantly, SK Square Co., Ltd. (KRX:402340) does carry debt. But is this debt a concern to shareholders?
Why Does Debt Bring Risk?
Generally speaking, debt only becomes a real problem when a company can't easily pay it off, either by raising capital or with its own cash flow. Ultimately, if the company can't fulfill its legal obligations to repay debt, shareholders could walk away with nothing. However, a more usual (but still expensive) situation is where a company must dilute shareholders at a cheap share price simply to get debt under control. Of course, debt can be an important tool in businesses, particularly capital heavy businesses. The first thing to do when considering how much debt a business uses is to look at its cash and debt together.
What Is SK Square's Debt?
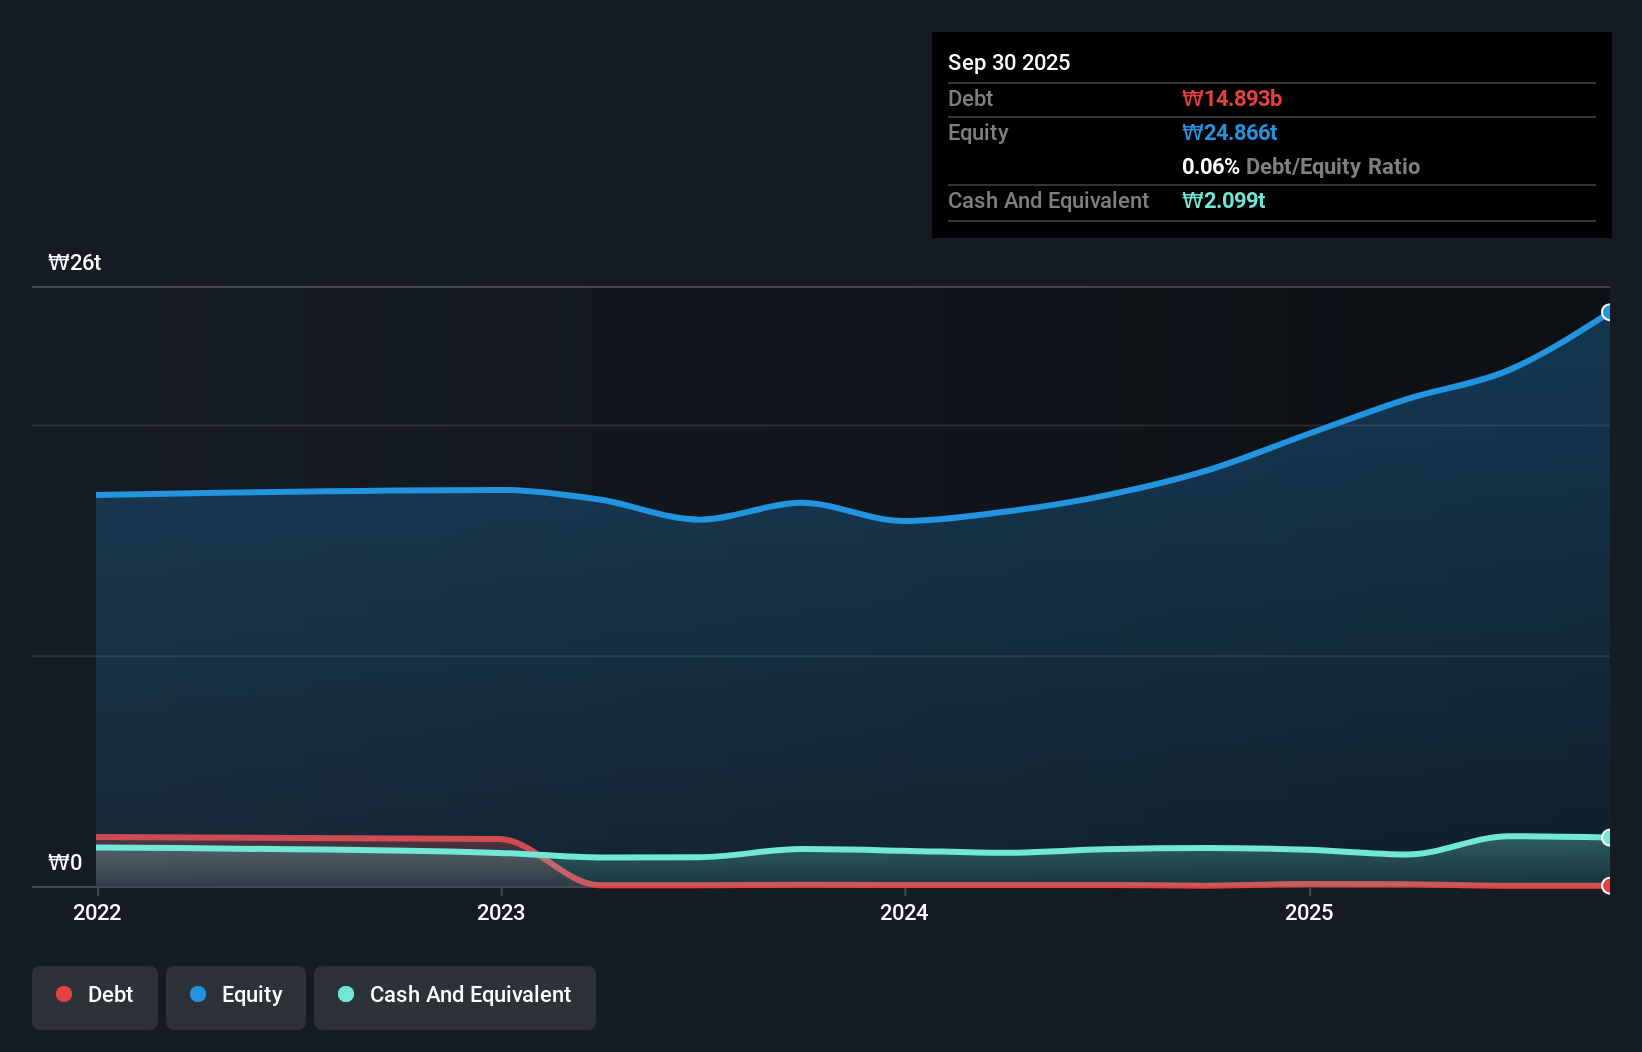
You can click the graphic below for the historical numbers, but it shows that SK Square had ₩14.9b of debt in September 2025, down from ₩16.0b, one year before. However, its balance sheet shows it holds ₩2.10t in cash, so it actually has ₩2.08t net cash.
How Healthy Is SK Square's Balance Sheet?
According to the last reported balance sheet, SK Square had liabilities of ₩1.20t due within 12 months, and liabilities of ₩1.18t due beyond 12 months. Offsetting these obligations, it had cash of ₩2.10t as well as receivables valued at ₩415.0b due within 12 months. So it actually has ₩125.5b more liquid assets than total liabilities.
This state of affairs indicates that SK Square's balance sheet looks quite solid, as its total liabilities are just about equal to its liquid assets. So while it's hard to imagine that the ₩43t company is struggling for cash, we still think it's worth monitoring its balance sheet. Simply put, the fact that SK Square has more cash than debt is arguably a good indication that it can manage its debt safely.
Check out our latest analysis for SK Square
Better yet, SK Square grew its EBIT by 227% last year, which is an impressive improvement. If maintained that growth will make the debt even more manageable in the years ahead. There's no doubt that we learn most about debt from the balance sheet. But ultimately the future profitability of the business will decide if SK Square can strengthen its balance sheet over time. So if you want to see what the professionals think, you might find this free report on analyst profit forecasts to be interesting.
Finally, while the tax-man may adore accounting profits, lenders only accept cold hard cash. While SK Square has net cash on its balance sheet, it's still worth taking a look at its ability to convert earnings before interest and tax (EBIT) to free cash flow, to help us understand how quickly it is building (or eroding) that cash balance. In the last two years, SK Square created free cash flow amounting to 5.0% of its EBIT, an uninspiring performance. That limp level of cash conversion undermines its ability to manage and pay down debt.
Summing Up
While we empathize with investors who find debt concerning, you should keep in mind that SK Square has net cash of ₩2.08t, as well as more liquid assets than liabilities. And we liked the look of last year's 227% year-on-year EBIT growth. So we don't think SK Square's use of debt is risky. The balance sheet is clearly the area to focus on when you are analysing debt. But ultimately, every company can contain risks that exist outside of the balance sheet. For example SK Square has 2 warning signs (and 1 which makes us a bit uncomfortable) we think you should know about.
When all is said and done, sometimes its easier to focus on companies that don't even need debt. Readers can access a list of growth stocks with zero net debt 100% free, right now.
Have feedback on this article? Concerned about the content? Get in touch with us directly. Alternatively, email editorial-team (at) simplywallst.com.
This article by Simply Wall St is general in nature. We provide commentary based on historical data and analyst forecasts only using an unbiased methodology and our articles are not intended to be financial advice. It does not constitute a recommendation to buy or sell any stock, and does not take account of your objectives, or your financial situation. We aim to bring you long-term focused analysis driven by fundamental data. Note that our analysis may not factor in the latest price-sensitive company announcements or qualitative material. Simply Wall St has no position in any stocks mentioned.