
With 67% institutional ownership, Multi Commodity Exchange of India Limited (NSE:MCX) is a favorite amongst the big guns
Key Insights
- Given the large stake in the stock by institutions, Multi Commodity Exchange of India's stock price might be vulnerable to their trading decisions
- The top 10 shareholders own 51% of the company
- Analyst forecasts along with ownership data serve to give a strong idea about prospects for a business
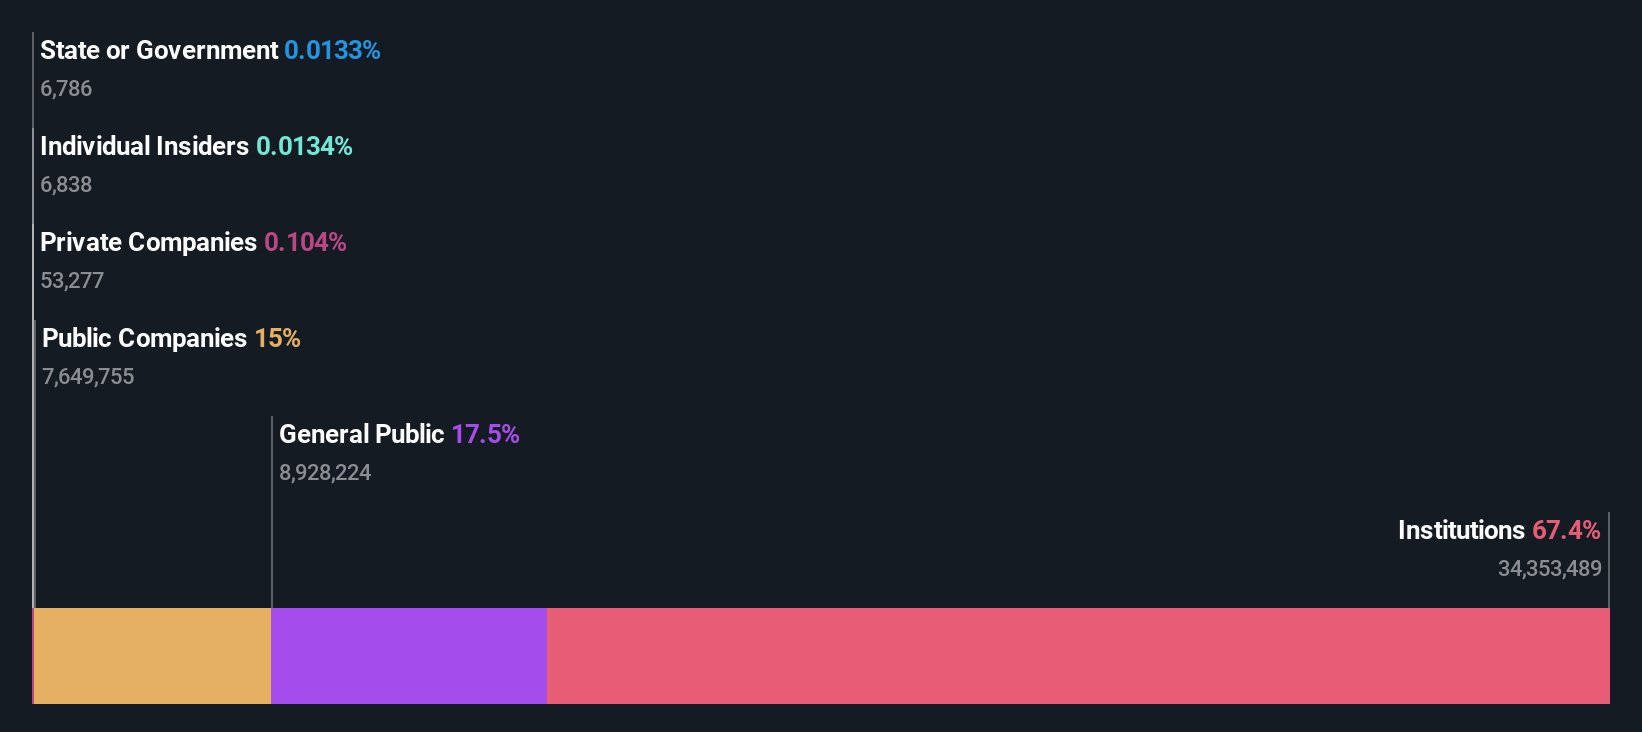
A look at the shareholders of Multi Commodity Exchange of India Limited (NSE:MCX) can tell us which group is most powerful. With 67% stake, institutions possess the maximum shares in the company. Put another way, the group faces the maximum upside potential (or downside risk).
Because institutional owners have a huge pool of resources and liquidity, their investing decisions tend to carry a great deal of weight, especially with individual investors. As a result, a sizeable amount of institutional money invested in a firm is generally viewed as a positive attribute.
Let's take a closer look to see what the different types of shareholders can tell us about Multi Commodity Exchange of India.
See our latest analysis for Multi Commodity Exchange of India
What Does The Institutional Ownership Tell Us About Multi Commodity Exchange of India?
Many institutions measure their performance against an index that approximates the local market. So they usually pay more attention to companies that are included in major indices.
We can see that Multi Commodity Exchange of India does have institutional investors; and they hold a good portion of the company's stock. This suggests some credibility amongst professional investors. But we can't rely on that fact alone since institutions make bad investments sometimes, just like everyone does. It is not uncommon to see a big share price drop if two large institutional investors try to sell out of a stock at the same time. So it is worth checking the past earnings trajectory of Multi Commodity Exchange of India, (below). Of course, keep in mind that there are other factors to consider, too.

Investors should note that institutions actually own more than half the company, so they can collectively wield significant power. Multi Commodity Exchange of India is not owned by hedge funds. Looking at our data, we can see that the largest shareholder is Kotak Mahindra Bank Limited with 15% of shares outstanding. In comparison, the second and third largest shareholders hold about 8.0% and 4.3% of the stock.
We did some more digging and found that 10 of the top shareholders account for roughly 51% of the register, implying that along with larger shareholders, there are a few smaller shareholders, thereby balancing out each others interests somewhat.
Researching institutional ownership is a good way to gauge and filter a stock's expected performance. The same can be achieved by studying analyst sentiments. Quite a few analysts cover the stock, so you could look into forecast growth quite easily.
Insider Ownership Of Multi Commodity Exchange of India
While the precise definition of an insider can be subjective, almost everyone considers board members to be insiders. The company management answer to the board and the latter should represent the interests of shareholders. Notably, sometimes top-level managers are on the board themselves.
Insider ownership is positive when it signals leadership are thinking like the true owners of the company. However, high insider ownership can also give immense power to a small group within the company. This can be negative in some circumstances.
Our information suggests that Multi Commodity Exchange of India Limited insiders own under 1% of the company. It's a big company, so even a small proportional interest can create alignment between the board and shareholders. In this case insiders own ₹71m worth of shares. It is good to see board members owning shares, but it might be worth checking if those insiders have been buying.
General Public Ownership
The general public, who are usually individual investors, hold a 18% stake in Multi Commodity Exchange of India. This size of ownership, while considerable, may not be enough to change company policy if the decision is not in sync with other large shareholders.
Public Company Ownership
Public companies currently own 15% of Multi Commodity Exchange of India stock. We can't be certain but it is quite possible this is a strategic stake. The businesses may be similar, or work together.
Next Steps:
While it is well worth considering the different groups that own a company, there are other factors that are even more important.
I like to dive deeper into how a company has performed in the past. You can access this interactive graph of past earnings, revenue and cash flow, for free.
If you would prefer discover what analysts are predicting in terms of future growth, do not miss this free report on analyst forecasts.
NB: Figures in this article are calculated using data from the last twelve months, which refer to the 12-month period ending on the last date of the month the financial statement is dated. This may not be consistent with full year annual report figures.
Have feedback on this article? Concerned about the content? Get in touch with us directly. Alternatively, email editorial-team (at) simplywallst.com.
This article by Simply Wall St is general in nature. We provide commentary based on historical data and analyst forecasts only using an unbiased methodology and our articles are not intended to be financial advice. It does not constitute a recommendation to buy or sell any stock, and does not take account of your objectives, or your financial situation. We aim to bring you long-term focused analysis driven by fundamental data. Note that our analysis may not factor in the latest price-sensitive company announcements or qualitative material. Simply Wall St has no position in any stocks mentioned.