
Has Yara’s 2025 Share Price Rally Already Priced In Its Growth Prospects?
- If you are wondering whether Yara International still represents good value after its recent share price increase, or if you might be late to the party, this breakdown will help you assess whether the current price makes sense.
- The stock has quietly climbed to around NOK 379.2, gaining 0.7% over the last week, 6.3% over the last month, 24.4% year to date, and 51.7% over the last 5 years.
- Recent moves have been shaped by shifting fertilizer demand expectations and ongoing discussion around food security and supply chain resilience. These factors tend to put Yara back on investors' radar when volatility picks up in commodity and energy markets. In addition, strategic initiatives in low carbon and clean ammonia solutions have reinforced the view that Yara is positioning itself for longer term structural growth rather than focusing only on short term price cycles.
- Right now, Yara scores a solid 5/6 on our valuation checks, suggesting it appears undervalued on most of the metrics we track, but not all. In the rest of this article we compare different valuation approaches, and then finish with a more holistic way to think about what Yara might be worth beyond the headline numbers.
Find out why Yara International's 17.7% return over the last year is lagging behind its peers.
Approach 1: Yara International Discounted Cash Flow (DCF) Analysis
A Discounted Cash Flow model estimates what a company is worth by projecting the cash it can generate in the future and discounting those cash flows back to today. For Yara International, this is done using a 2 Stage Free Cash Flow to Equity model based on cash flow projections.
Yara generated trailing twelve month free cash flow of around $634.7 Million. Analyst forecasts and Simply Wall St extrapolations indicate a potential increase to about $1.31 Billion by 2035, with intermediate projections such as roughly $1.06 Billion in 2026 and $1.12 Billion in 2029 stepping the business to a higher cash flow base over the next decade.
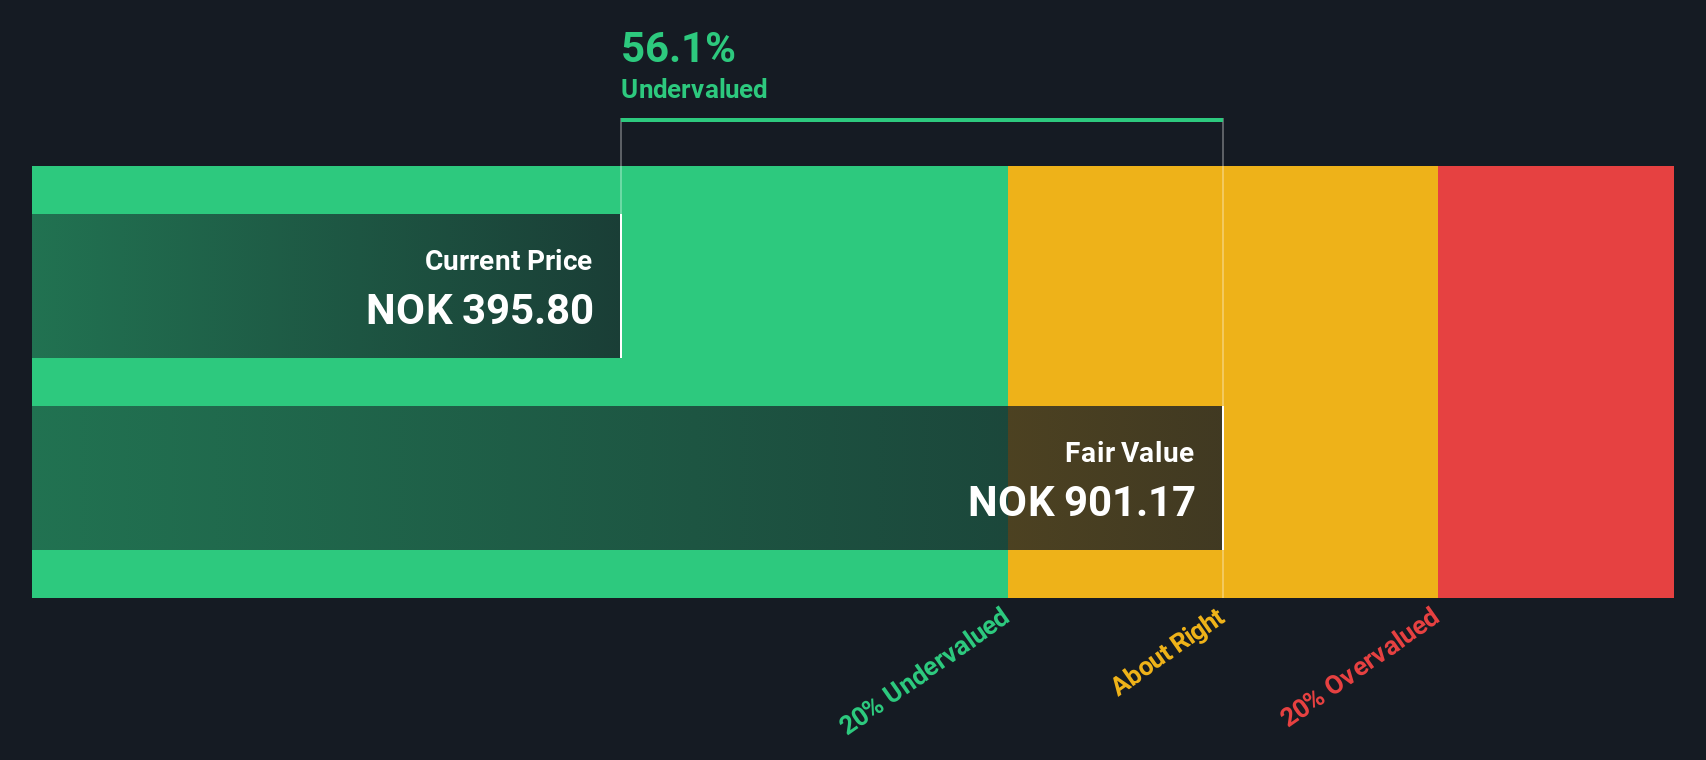
When these projected cash flows are discounted back to today, the model arrives at an estimated intrinsic value of roughly NOK 898 per share. Compared with the current share price of about NOK 379, the DCF suggests that Yara trades at roughly a 57.8% discount to this modeled value, which would represent meaningful upside if the assumptions used were to hold.
Result: UNDERVALUED
Our Discounted Cash Flow (DCF) analysis suggests Yara International is undervalued by 57.8%. Track this in your watchlist or portfolio, or discover 903 more undervalued stocks based on cash flows.
Approach 2: Yara International Price vs Earnings
For profitable companies like Yara, the price to earnings, or PE, ratio is a useful way to gauge whether investors are paying a reasonable price for each unit of current earnings. In general, higher growth prospects and lower perceived risk justify a higher, or more expensive, PE multiple, while slower or more volatile businesses tend to trade on lower PE ratios.
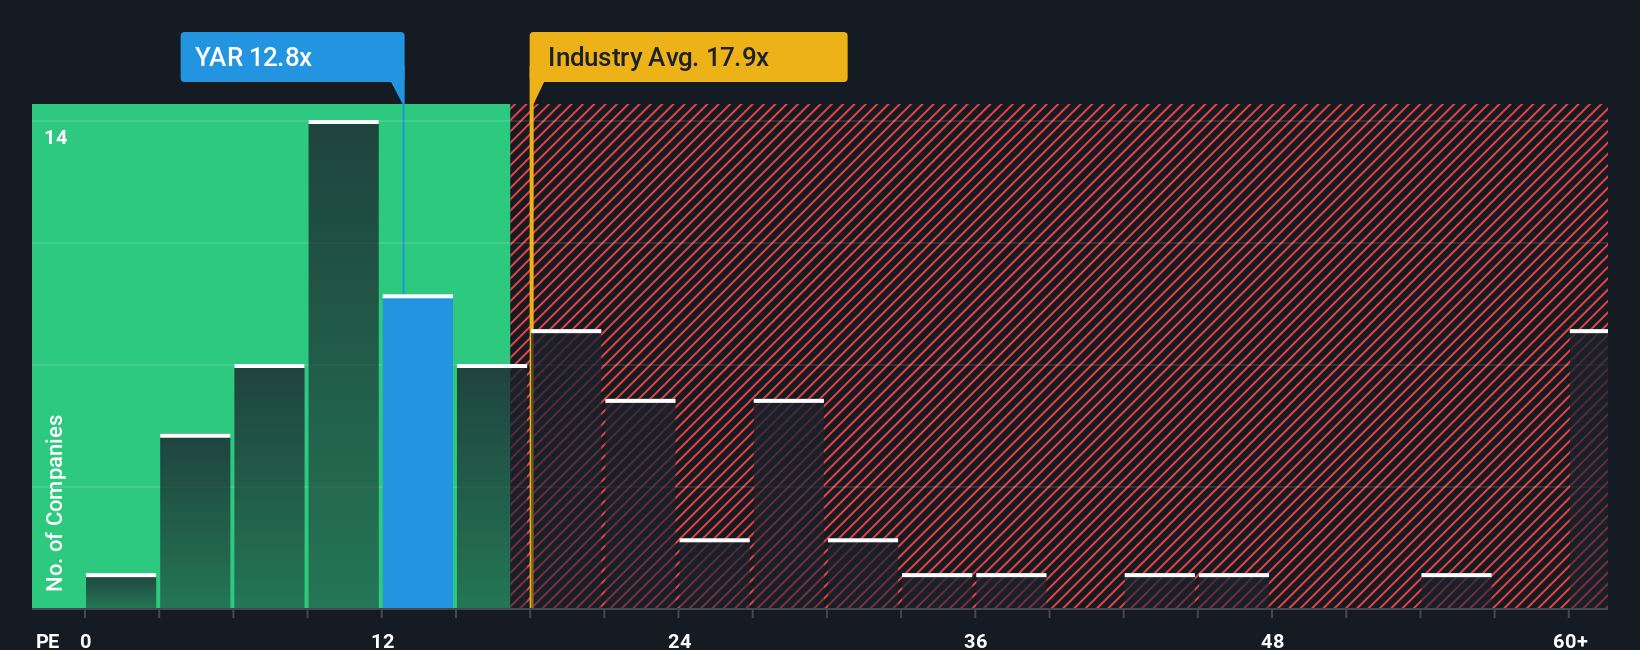
Yara currently trades on a PE of about 13.0x, which is well below both the Chemicals industry average of around 20.9x and the broader peer group average of roughly 21.6x. On the surface, that discount suggests the market is either more cautious on Yara’s outlook or has not fully repriced its improving fundamentals.
Simply Wall St’s Fair Ratio framework goes a step further by estimating what PE multiple would be appropriate for Yara specifically, given its earnings growth profile, margins, industry, market cap and risk characteristics. For Yara, this Fair Ratio comes out at about 15.3x, implying the shares deserve a higher multiple than they currently receive. Because this approach adjusts for company specific fundamentals rather than relying purely on blunt peer comparisons, it offers a more tailored view of value and, in Yara’s case, points to the stock being modestly undervalued on an earnings basis.
Result: UNDERVALUED
PE ratios tell one story, but what if the real opportunity lies elsewhere? Discover 1450 companies where insiders are betting big on explosive growth.
Upgrade Your Decision Making: Choose your Yara International Narrative
Earlier we mentioned that there is an even better way to understand valuation, so let us introduce you to Narratives, a simple framework on Simply Wall St’s Community page. There you connect your story about a company with concrete forecasts for revenue, earnings and margins, and then see what fair value those assumptions imply. This can make it easier to decide when to buy or sell by comparing that fair value to today’s price, track how your view changes as new news or earnings automatically update the numbers, and understand how other investors can look at the same Yara International data and still disagree. For example, one Narrative might assume policy headwinds and tougher competition that supports a fair value closer to the most bearish analyst target of about NOK 270. Another Narrative might lean into premium products, clean ammonia upside and supportive regulation to justify something near the most bullish target of around NOK 450.
Do you think there's more to the story for Yara International? Head over to our Community to see what others are saying!

This article by Simply Wall St is general in nature. We provide commentary based on historical data and analyst forecasts only using an unbiased methodology and our articles are not intended to be financial advice. It does not constitute a recommendation to buy or sell any stock, and does not take account of your objectives, or your financial situation. We aim to bring you long-term focused analysis driven by fundamental data. Note that our analysis may not factor in the latest price-sensitive company announcements or qualitative material. Simply Wall St has no position in any stocks mentioned.
Have feedback on this article? Concerned about the content? Get in touch with us directly. Alternatively, email editorial-team@simplywallst.com