
Virgin Galactic (SPCE): Evaluating Valuation After a Volatile Share Price Recovery
Virgin Galactic Holdings (SPCE) has been on a wild ride lately, with shares sliding over the past year but bouncing in the past 3 months, and that volatility is exactly what catches investors attention.
See our latest analysis for Virgin Galactic Holdings.
That backdrop puts the latest $3.81 share price in perspective, with a 90 day share price return of 21.7 percent contrasting sharply with a deeply negative five year total shareholder return. This hints that sentiment may be stabilising but remains fragile.
If Virgin Galactic feels too volatile for your taste, it could be worth exploring other aerospace and defense names through aerospace and defense stocks as potential long term compounders.
With shares still trading near penny stock territory despite rapid top line growth but heavy losses, investors face a dilemma: is Virgin Galactic a discounted bet on commercial spaceflight, or has the market already priced in any realistic recovery?
Price to Book of 1.1x: Is it justified?
Virgin Galactic's recent close at $3.81 equates to a price to book ratio of roughly 1.1 times, which screens as cheap against peers and the wider aerospace and defense industry.
The price to book multiple compares the market value of the company to the accounting value of its net assets. This can be a useful lens for capital intensive businesses like spaceflight where tangible assets and intellectual property dominate the balance sheet rather than steady profits.
According to the Simply Wall St checks, SPCE is regarded as good value on this basis, with its 1.1 times price to book ratio sitting well below both the peer group average of 2.7 times and the broader US aerospace and defense industry at 3.5 times. This suggests investors are assigning a heavily discounted valuation to the company's asset base despite forecasts of rapid revenue and earnings growth in the years ahead.
This discount is stark. The market is valuing each dollar of Virgin Galactic's book equity at a fraction of what it awards more established industry players, hinting that sentiment and execution risk are overpowering any enthusiasm around its long term growth profile.
See what the numbers say about this price — find out in our valuation breakdown.
Result: Price to Book of 1.1x (UNDERVALUED)
However, significant cash burn and ongoing losses, alongside execution risk in scaling commercial flights safely, could quickly derail any tentative recovery in sentiment.
Find out about the key risks to this Virgin Galactic Holdings narrative.
Another View: Our DCF Model Paints a Wilder Picture
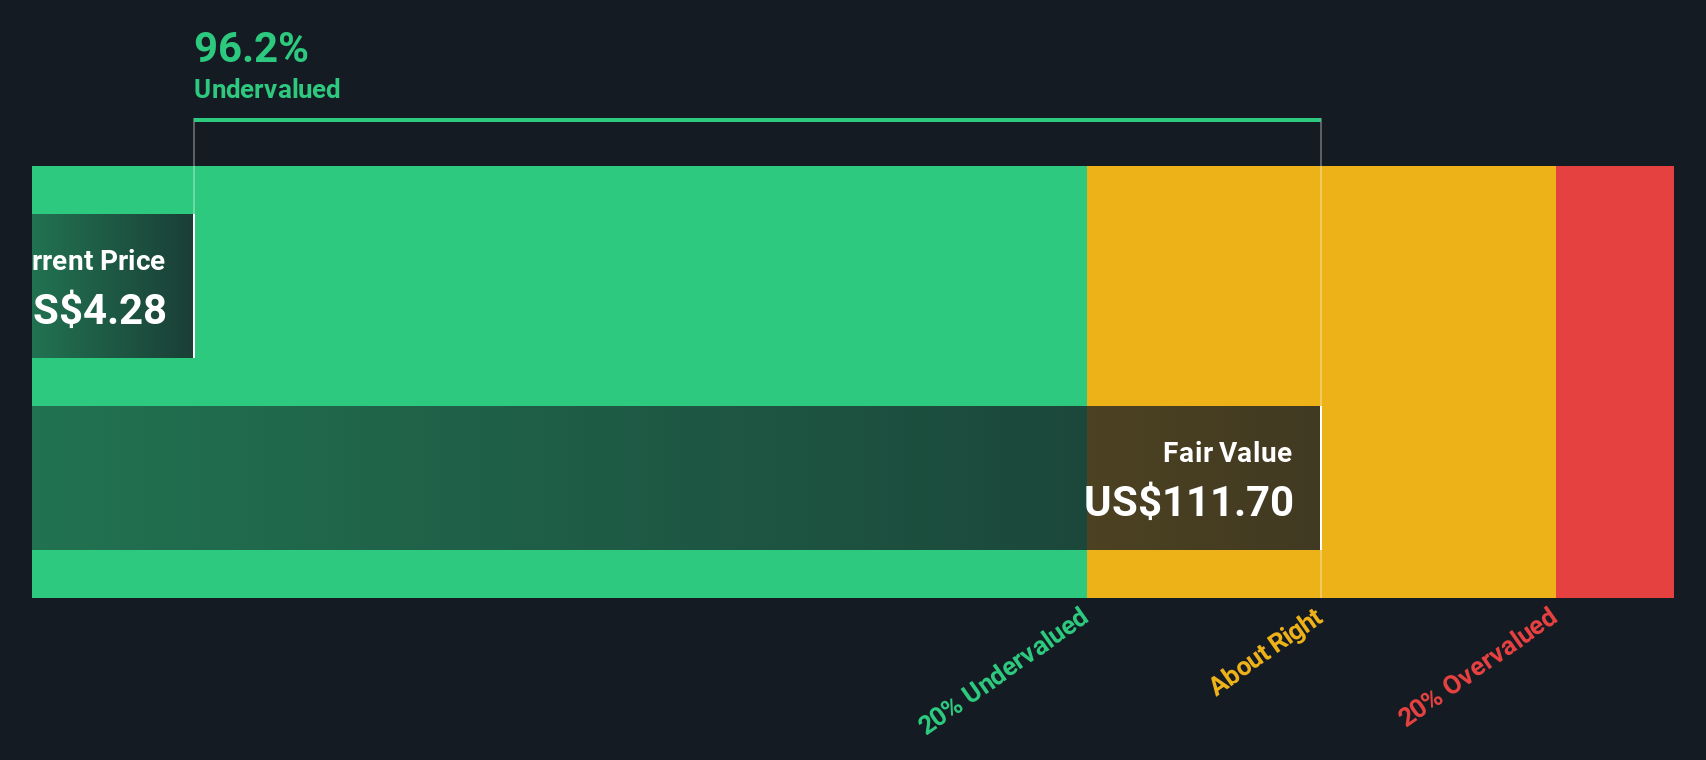
While the 1.1 times price to book ratio looks modest, our DCF model sees something far more extreme. It suggests SPCE trades about 96 percent below its estimated fair value of roughly $98 per share. Is this a massive opportunity, or just a model running ahead of reality?
Look into how the SWS DCF model arrives at its fair value.
Simply Wall St performs a discounted cash flow (DCF) on every stock in the world every day (check out Virgin Galactic Holdings for example). We show the entire calculation in full. You can track the result in your watchlist or portfolio and be alerted when this changes, or use our stock screener to discover 903 undervalued stocks based on their cash flows. If you save a screener we even alert you when new companies match - so you never miss a potential opportunity.
Build Your Own Virgin Galactic Holdings Narrative
If you are unconvinced by this framing or prefer to dig into the numbers yourself, you can build a personalised view in just a few minutes: Do it your way.
A great starting point for your Virgin Galactic Holdings research is our analysis highlighting 3 key rewards and 2 important warning signs that could impact your investment decision.
Looking for more investment ideas?
Do not stop your research with one stock; use the Simply Wall St Screener now to uncover focused opportunities you would regret missing later.
- Capture potential multi-bagger opportunities early by scanning these 3588 penny stocks with strong financials built on improving fundamentals and realistic growth expectations.
- Position your portfolio for the next productivity revolution by targeting companies at the heart of these 27 AI penny stocks and real world AI adoption.
- Lock in better value entry points by filtering for these 903 undervalued stocks based on cash flows that trade below what their cash flows may justify.
This article by Simply Wall St is general in nature. We provide commentary based on historical data and analyst forecasts only using an unbiased methodology and our articles are not intended to be financial advice. It does not constitute a recommendation to buy or sell any stock, and does not take account of your objectives, or your financial situation. We aim to bring you long-term focused analysis driven by fundamental data. Note that our analysis may not factor in the latest price-sensitive company announcements or qualitative material. Simply Wall St has no position in any stocks mentioned.
Have feedback on this article? Concerned about the content? Get in touch with us directly. Alternatively, email editorial-team@simplywallst.com