
Has RTX’s 48% Surge in 2025 Already Priced In Defense and Aerospace Tailwinds?
- If you are wondering whether RTX is still worth buying after its huge run, or if you are turning up late to the party, you are not alone. This is exactly what we are going to unpack.
- RTX has climbed 48.9% over the last year and 171.4% over five years, even though the last 30 days saw a modest 2.8% pullback after a 1.9% gain in the past week and a 48.2% jump year to date.
- Recent headlines have focused on RTX's position as a key defense and aerospace supplier as geopolitical tensions stay elevated, alongside ongoing interest in its long term commercial aviation exposure and modernization programs. Together, these themes help explain why investors have been willing to re rate the stock, even as shorter term volatility creeps in.
- Despite that backdrop, RTX only scores a 2/6 valuation check rating. Next, we will break down what different valuation methods are saying about the stock today, and then finish with a more intuitive way to think about RTX's value that many investors overlook.
RTX scores just 2/6 on our valuation checks. See what other red flags we found in the full valuation breakdown.
Approach 1: RTX Discounted Cash Flow (DCF) Analysis
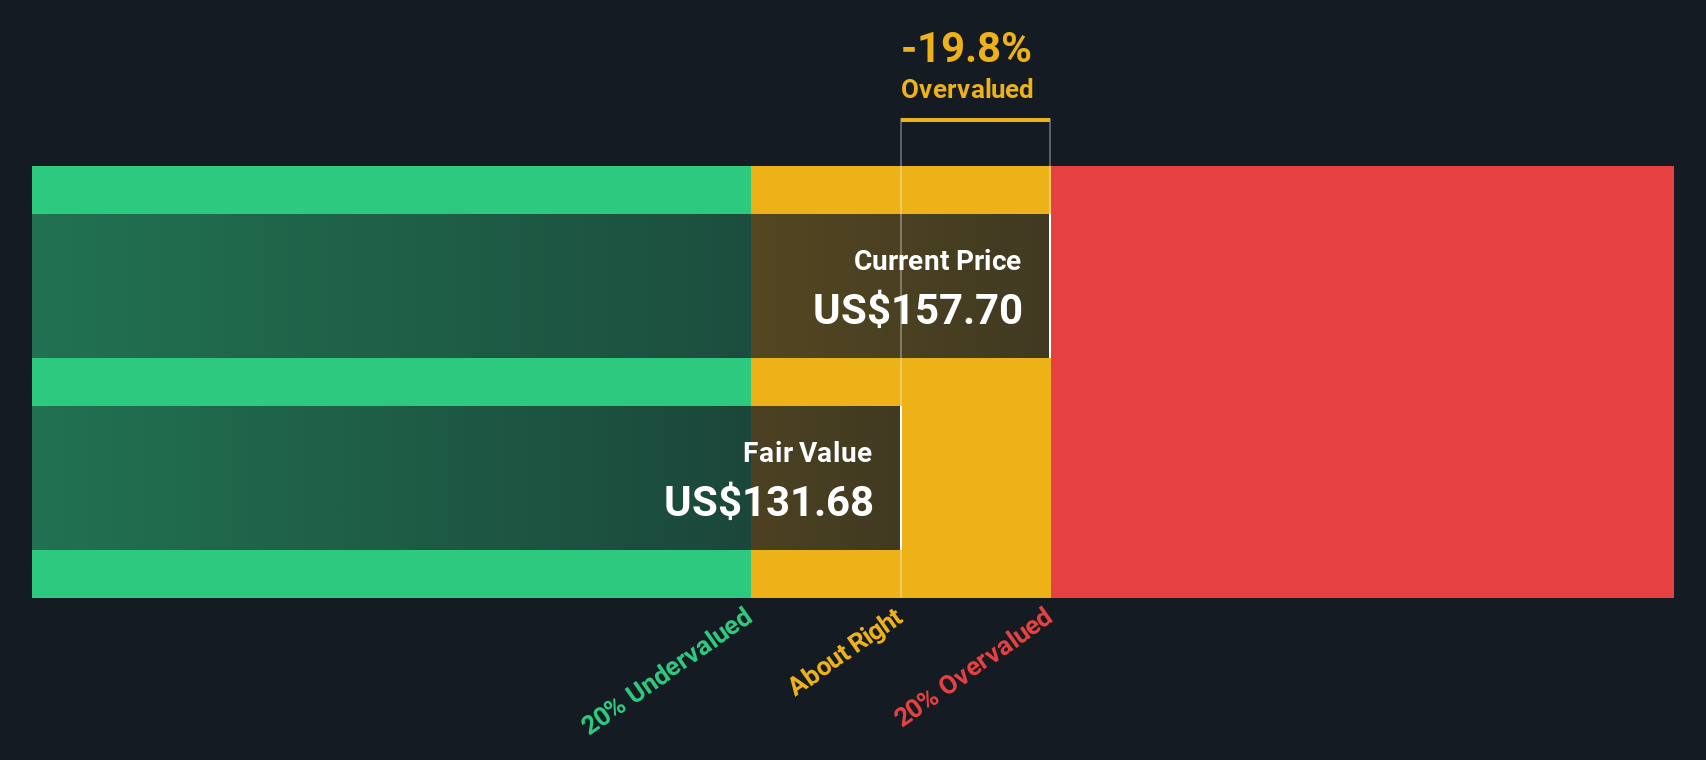
A Discounted Cash Flow model estimates what a company is worth by projecting its future cash flows and then discounting them back to today in $ terms. For RTX, the model starts with last twelve month free cash flow of about $4.5 Billion and uses analyst forecasts for the next few years, then extrapolates further growth using a 2 Stage Free Cash Flow to Equity framework.
Under this approach, RTX’s free cash flow is projected to reach roughly $12.5 Billion by 2035, with intermediate years like 2029 expected around $10.8 Billion. These future cash flows are discounted back to today to arrive at an estimated intrinsic value of $151.35 per share.
Compared with the current share price, this DCF output implies RTX is about 13.6% overvalued. This suggests the market is already pricing in a lot of future growth and cash generation. In other words, the cash flow story is strong but not cheap at today’s levels.
Result: OVERVALUED
Our Discounted Cash Flow (DCF) analysis suggests RTX may be overvalued by 13.6%. Discover 904 undervalued stocks or create your own screener to find better value opportunities.
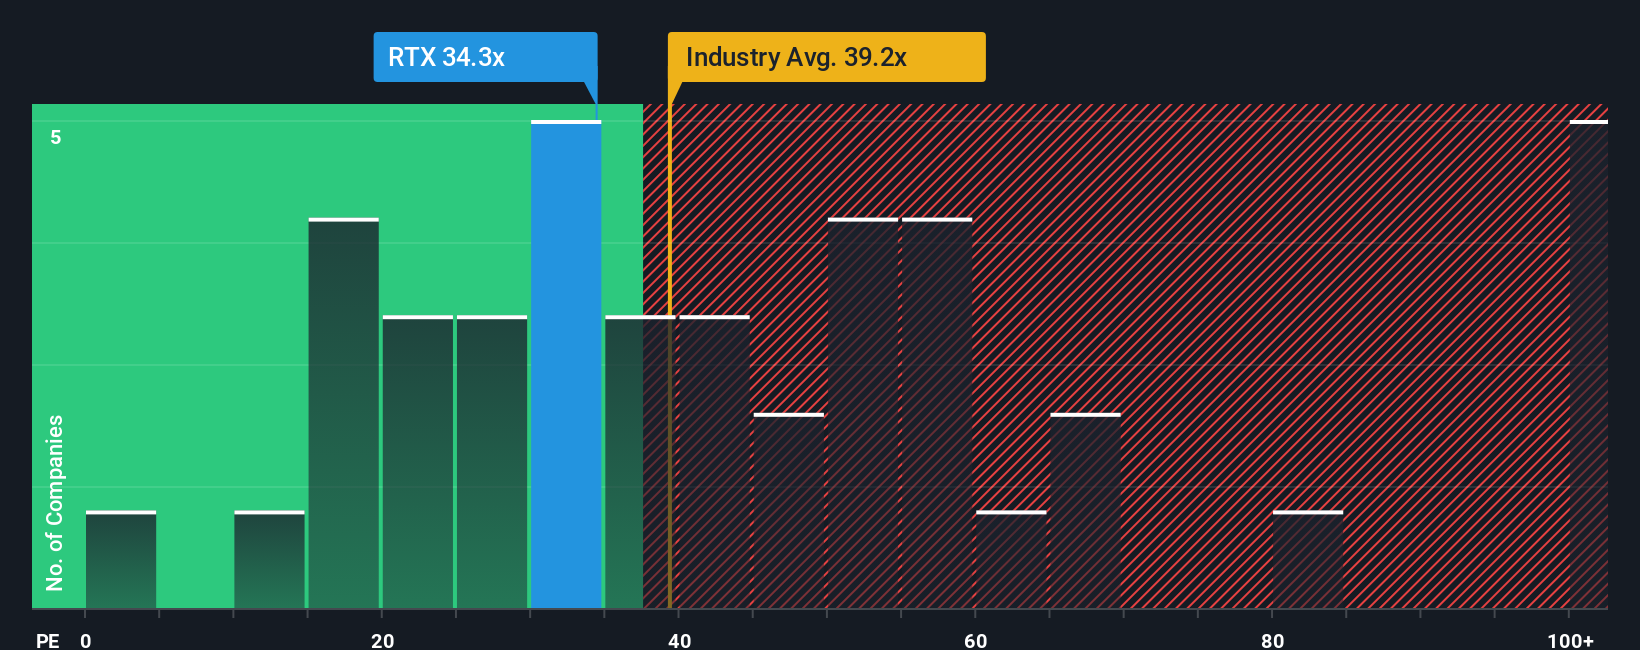
Approach 2: RTX Price vs Earnings
For profitable, established businesses like RTX, the price to earnings multiple is often the most intuitive yardstick, because it links the share price directly to the company’s current earning power. In general, faster and more resilient earnings growth can justify a higher PE, while more cyclical or risky earnings usually deserve a lower one.
RTX currently trades on a PE of about 35x. That is slightly above its Aerospace and Defense industry average of roughly 37.1x, but in line with close peers at around 34.4x, suggesting the market is pricing RTX broadly in line with its sector. Simply Wall St’s Fair Ratio for RTX is 35.4x, which is a proprietary estimate of what the PE should be once you factor in the company’s growth outlook, profitability, risk profile, industry positioning and market cap.
This Fair Ratio is more informative than a simple peer or industry comparison, because it adjusts for RTX specific strengths and risks rather than assuming all defense names deserve the same multiple. With RTX at about 35x versus a Fair Ratio of 35.4x, the stock appears to be priced very close to what its fundamentals warrant.
Result: ABOUT RIGHT
PE ratios tell one story, but what if the real opportunity lies elsewhere? Discover 1450 companies where insiders are betting big on explosive growth.
Upgrade Your Decision Making: Choose your RTX Narrative
Earlier we mentioned that there is an even better way to understand valuation, so let us introduce you to Narratives, which are simply the stories investors tell about a company that connect their view of its future revenue, earnings and margins to a financial forecast and, ultimately, a fair value estimate. On Simply Wall St’s Community page, used by millions of investors, Narratives give you an easy way to write down your perspective, link it to explicit assumptions, and instantly see what fair value those assumptions imply, then compare that to today’s share price to decide whether RTX looks like a buy, hold or sell. Because Narratives update dynamically when new information, such as earnings results or major news, comes in, they stay fresh and aligned with reality rather than becoming stale spreadsheets on your desktop. For RTX, one investor might build a bullish Narrative around sustained defense demand and cybersecurity tailwinds that supports a fair value near the high end of community estimates. Another may focus on engine risks, budget dependence and fixed costs to justify a more conservative fair value near the low end, and the platform lets you see and compare both side by side.
Do you think there's more to the story for RTX? Head over to our Community to see what others are saying!

This article by Simply Wall St is general in nature. We provide commentary based on historical data and analyst forecasts only using an unbiased methodology and our articles are not intended to be financial advice. It does not constitute a recommendation to buy or sell any stock, and does not take account of your objectives, or your financial situation. We aim to bring you long-term focused analysis driven by fundamental data. Note that our analysis may not factor in the latest price-sensitive company announcements or qualitative material. Simply Wall St has no position in any stocks mentioned.
Have feedback on this article? Concerned about the content? Get in touch with us directly. Alternatively, email editorial-team@simplywallst.com