
Is It Too Late to Consider IBM After Its Strong AI Focused Share Price Rally?
How Has IBM Stock Been Performing Lately
International Business Machines has been on many investors watchlists lately, raising the question of whether its current share price offers real value or if most of the upside has already been captured. With a long history and a renewed focus on hybrid cloud and AI, IBM is again at the center of the value versus growth debate.
Over the last year, IBM shares have delivered a strong 37.5% return, with gains of 2.9% over the past week and 1.3% over the last month. Looking further back, the stock has climbed 41.2% year to date, 130.1% over three years and 217.5% over five years, reflecting a solid multiyear rerating.
Recent news around IBM has highlighted its continued push into AI and hybrid cloud, including new partnerships and product launches that aim to deepen its enterprise footprint. At the same time, broader market interest in AI infrastructure and mission critical software providers has helped support sentiment, contributing to the stock’s upward trend.
Despite this strong performance, IBM currently scores just 1/6 on our valuation checks, suggesting the market may already be pricing in a lot of the good news. Next, we will unpack what different valuation approaches say about IBM, and then look at an even more powerful way to think about what the stock might really be worth.
International Business Machines scores just 1/6 on our valuation checks. See what other red flags we found in the full valuation breakdown.
Approach 1: International Business Machines Discounted Cash Flow (DCF) Analysis
A Discounted Cash Flow model estimates what a company is worth today by projecting the cash it can generate in the future and then discounting those cash flows back to their value in $ today.
For International Business Machines, the latest twelve month free cash flow is about $11.7 billion. Analyst forecasts and Simply Wall St extrapolations anticipate this growing steadily, with projected free cash flow reaching roughly $23.0 billion by 2035 as the business continues to scale its hybrid cloud and AI offerings. These projections use a 2 Stage Free Cash Flow to Equity framework, where near term analyst estimates transition into longer term, slowing growth assumptions.
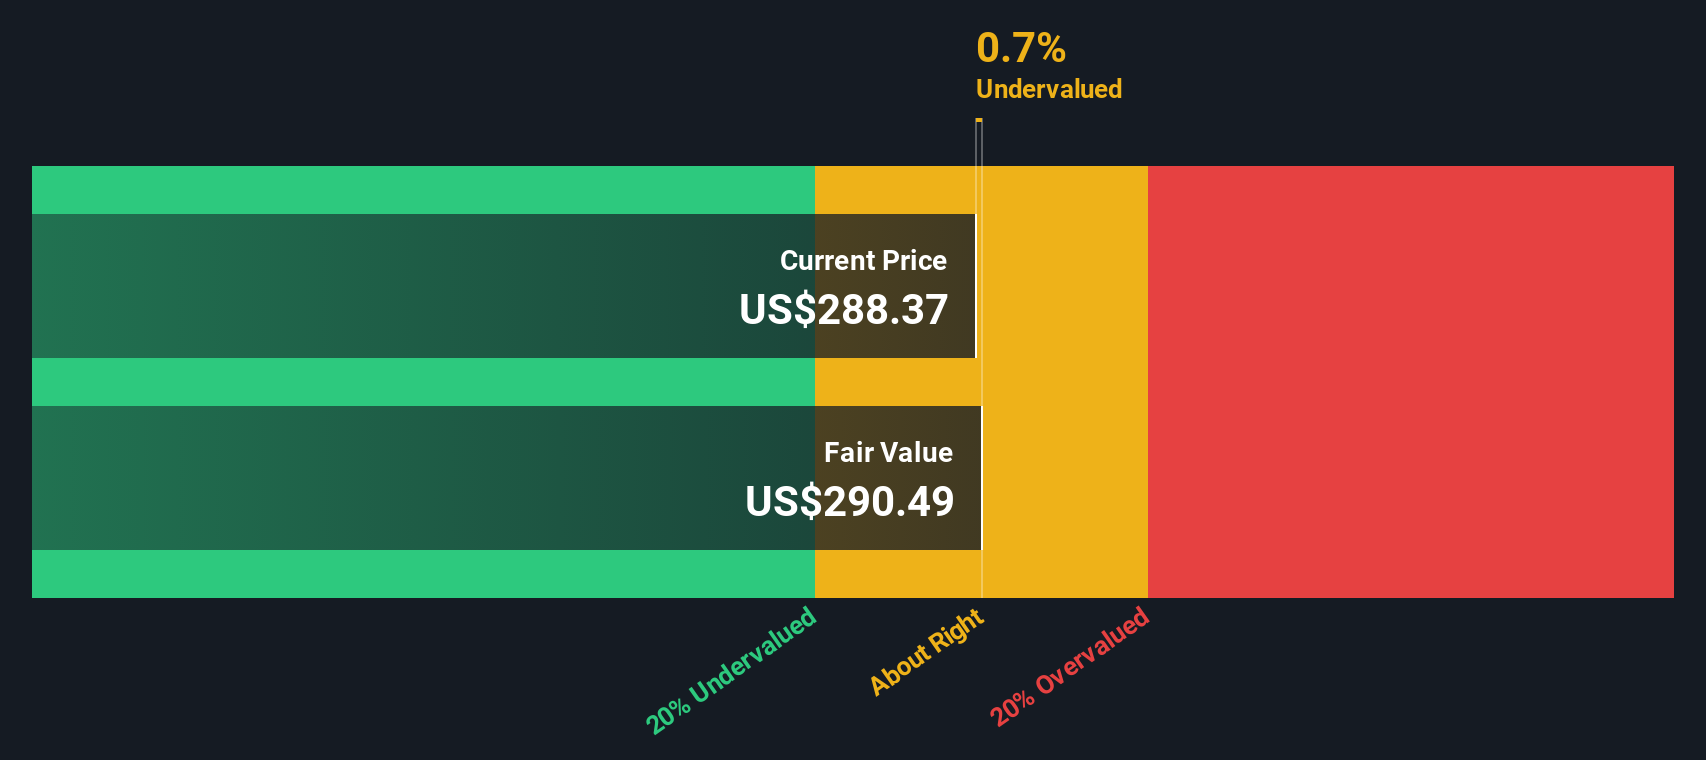
When all those future cash flows are discounted back, the model arrives at an intrinsic value of about $282.64 per share. Compared with the current share price, this implies IBM is roughly 9.9% overvalued, which suggests the market is assigning a small premium to its future cash generation prospects.
Result: ABOUT RIGHT
International Business Machines is fairly valued according to our Discounted Cash Flow (DCF), but this can change at a moment's notice. Track the value in your watchlist or portfolio and be alerted on when to act.
Approach 2: International Business Machines Price vs Earnings
For a mature, consistently profitable business like International Business Machines, the Price to Earnings ratio is a sensible way to gauge valuation because it directly compares what investors are paying with the company’s current earnings power. In general, companies with stronger, more reliable growth and lower risk can justify a higher PE multiple. Slower growth or higher uncertainty should command a lower, more conservative PE.
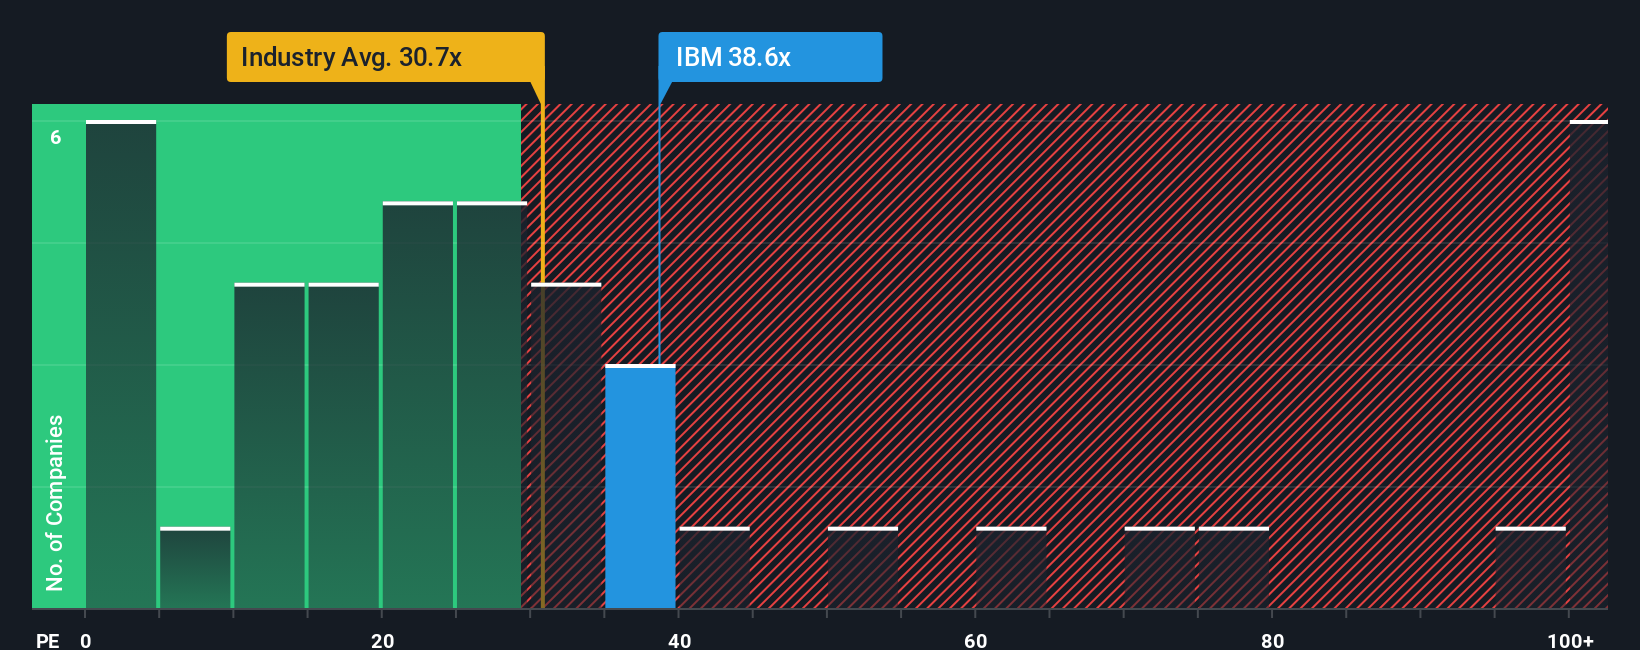
IBM currently trades on a PE of about 36.65x, which sits above both the broader IT industry average of roughly 30.54x and the peer group average of around 21.72x. On the surface, that premium suggests the market is willing to pay up for IBM’s earnings, possibly reflecting confidence in its hybrid cloud and AI strategy.
Simply Wall St’s Fair Ratio framework refines this simple comparison by estimating what PE IBM should trade on, given its earnings growth outlook, profitability, industry, market cap and specific risk profile. For IBM, the Fair Ratio comes out at approximately 39.17x, which is modestly higher than its current PE. That implies the stock is trading at a slight discount to the multiple its fundamentals could warrant, pointing to a degree of undervaluation rather than excessive optimism.
Result: UNDERVALUED
PE ratios tell one story, but what if the real opportunity lies elsewhere? Discover 1450 companies where insiders are betting big on explosive growth.
Upgrade Your Decision Making: Choose your International Business Machines Narrative
Earlier we mentioned that there is an even better way to understand valuation. Let us introduce you to Narratives, a simple way to connect your view of IBM’s story with a concrete financial forecast and Fair Value, instead of relying only on static PE ratios or DCF models.
A Narrative on Simply Wall St is your own story behind the numbers. You combine assumptions about IBM’s future revenue, earnings and margins with your perspective on its hybrid cloud, AI, and quantum strategy to generate a Fair Value that you can directly compare with today’s share price to inform a decision on whether to buy, hold, or sell.
These Narratives live in the Community page used by millions of investors. They are easy to set up and update dynamically when new information such as earnings reports, major product launches or macro news becomes available, so your Fair Value estimate does not go stale.
For example, one IBM Narrative might lean bullish and see potential value around $350 per share if AI and quantum adoption outpace expectations. A more cautious Narrative could justify closer to $198 if competition and legacy headwinds dominate. Both perspectives can coexist and be tracked side by side as the data changes.
For International Business Machines however we will make it really easy for you with previews of two leading International Business Machines Narratives:
🐂 International Business Machines Bull Case
Fair Value: $350.00 per share
Implied discount to Fair Value: -11.4%
Revenue growth assumption: 6.1%
- Assumes AI, hybrid cloud, and modernization demand, especially in regulated sectors, drives structurally higher revenue growth and margins for multiple years.
- Sees integration of Red Hat, HashiCorp, and other platforms accelerating the shift toward high margin, recurring software and stronger free cash flow.
- Views IBM's progress in quantum computing, automation, and mission critical infrastructure as putting it in a leadership position that justifies a premium valuation.
🐻 International Business Machines Bear Case
Fair Value: $290.89 per share
Implied downside to Fair Value: 6.7%
Revenue growth assumption: 5.2%
- Expects solid but more measured growth from hybrid cloud, AI, and z17, with valuation already reflecting much of the medium term improvement.
- Highlights macro uncertainty, consulting cyclicality, currency swings, and competitive pressures in software as constraints on upside.
- Sees IBM as broadly fairly valued around consensus targets, with long term quantum and software execution important, but not yet enough to support a much higher multiple.
Do you think there's more to the story for International Business Machines? Head over to our Community to see what others are saying!

This article by Simply Wall St is general in nature. We provide commentary based on historical data and analyst forecasts only using an unbiased methodology and our articles are not intended to be financial advice. It does not constitute a recommendation to buy or sell any stock, and does not take account of your objectives, or your financial situation. We aim to bring you long-term focused analysis driven by fundamental data. Note that our analysis may not factor in the latest price-sensitive company announcements or qualitative material. Simply Wall St has no position in any stocks mentioned.
Have feedback on this article? Concerned about the content? Get in touch with us directly. Alternatively, email editorial-team@simplywallst.com