
Has Vistra’s AI Power Story Already Run Its Course After a 613% Surge?
- Wondering if Vistra is still worth buying after its massive run, or if most of the upside is already baked into the price? Here is a closer look at what the current share price implies about its future.
- After an explosive multiyear climb of 613.3% over 3 years and 891.3% over 5 years, the stock has cooled off recently, slipping 4.5% in the last week and 13.7% over the past month, while still sitting on a 10.1% gain year to date and 17.1% over the last year.
- These moves are happening against a backdrop of growing interest in power producers tied to data center and AI driven electricity demand, along with ongoing attention on US grid reliability and the transition to lower carbon generation. Together, those themes have helped reframe Vistra from a traditional utility into a key player in the energy transition narrative. Investors are now trying to reprice that story more carefully.
- On our framework, Vistra scores a 2 out of 6 valuation checks, meaning it screens as undervalued on only a couple of metrics, but not across the board, which is where things get interesting. Next we will dig into different valuation approaches to see what they each say about the stock, before finishing with a more holistic way to think about Vistra's value.
Vistra scores just 2/6 on our valuation checks. See what other red flags we found in the full valuation breakdown.
Approach 1: Vistra Discounted Cash Flow (DCF) Analysis
A Discounted Cash Flow model estimates what a company is worth by projecting the cash it can generate in the future and then discounting those cash flows back to today in dollar terms.
For Vistra, the latest twelve month free cash flow is about $1.31 billion, and analysts, combined with Simply Wall St extrapolations, see this rising to roughly $8.14 billion by 2035. The projections use a 2 Stage Free Cash Flow to Equity framework, where near term analyst estimates are followed by a slower, more mature growth phase. Each of these annual cash flows is discounted back to its present value and then summed to arrive at an intrinsic value per share.
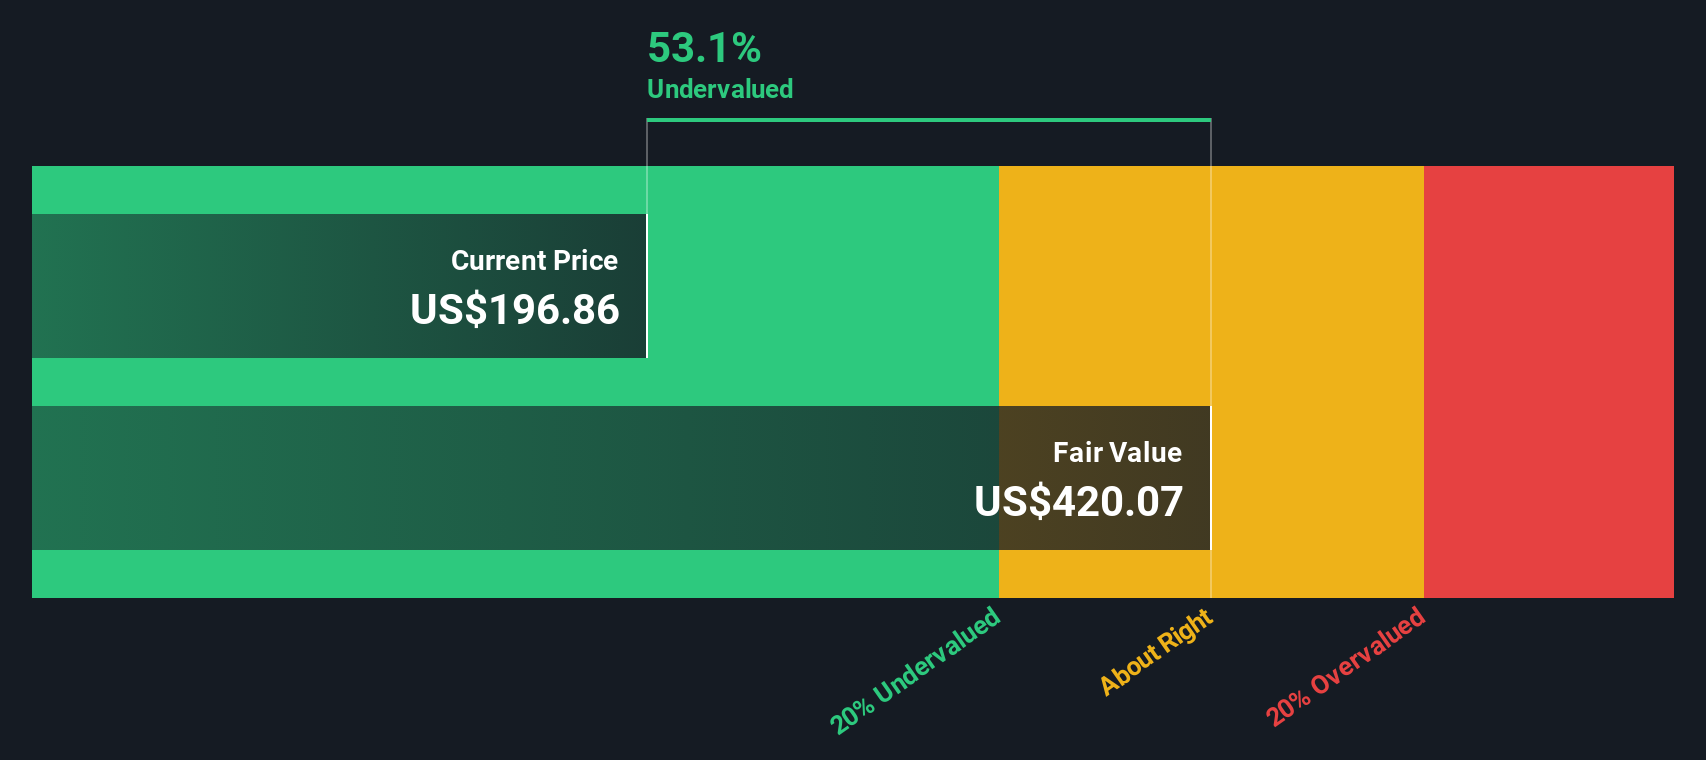
On this basis, the DCF model suggests a fair value of about $375.42 per share. Compared with the current market price, this implies Vistra is trading at roughly a 56.1% discount to its estimated intrinsic value, signalling that the market may be underappreciating its future cash generation potential.
Result: UNDERVALUED
Our Discounted Cash Flow (DCF) analysis suggests Vistra is undervalued by 56.1%. Track this in your watchlist or portfolio, or discover 903 more undervalued stocks based on cash flows.
Approach 2: Vistra Price vs Earnings
For profitable companies like Vistra, the price to earnings, or PE, ratio is a useful way to gauge how much investors are paying for each dollar of current earnings. Investors typically accept a higher PE when they expect strong, durable growth and lower risk, while slower growth or higher uncertainty usually calls for a lower, more conservative multiple.
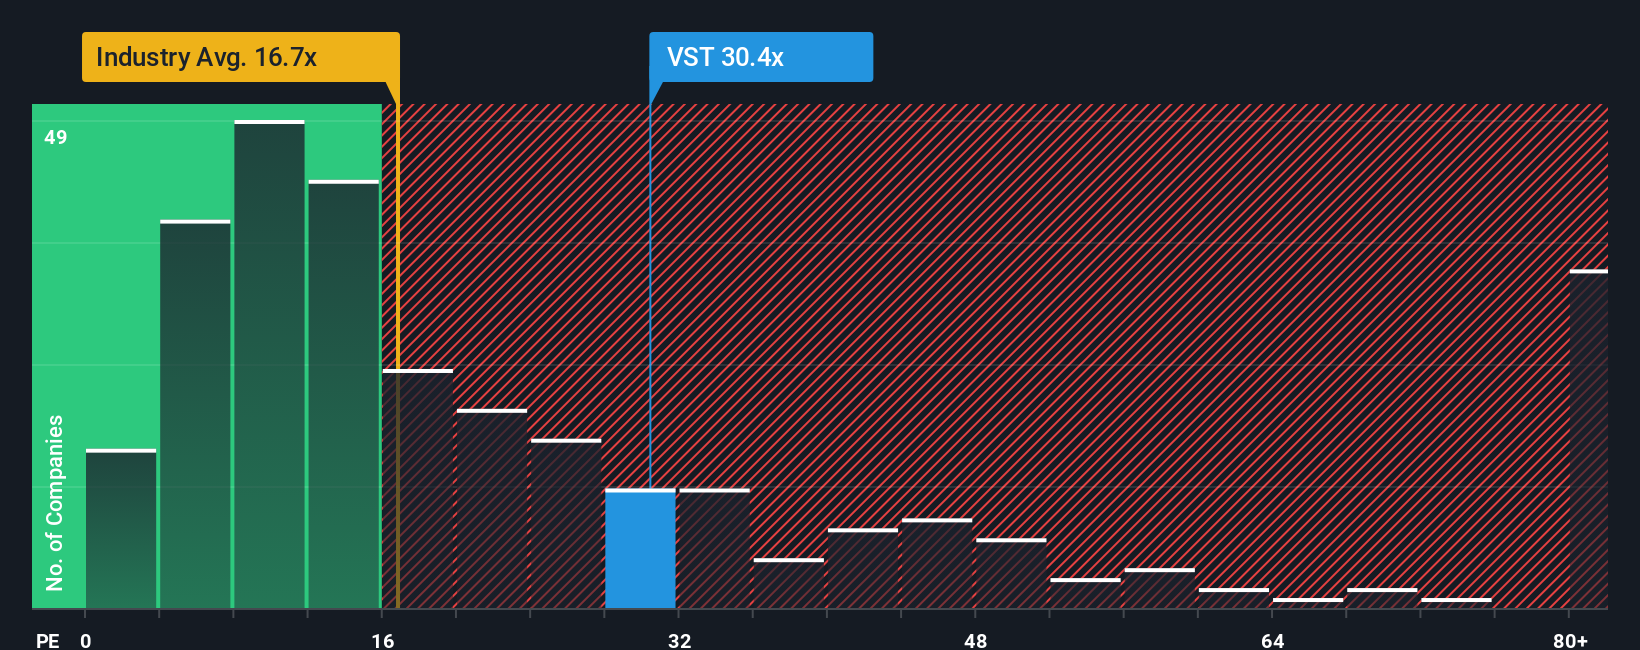
Vistra currently trades on a PE of about 58.17x, which is well above both the broader renewable energy industry average of roughly 16.88x and the peer group average of around 28.92x. Simply Wall St also calculates a proprietary Fair Ratio of 46.86x for Vistra, which represents the PE multiple that would be reasonable given its specific combination of earnings growth prospects, profitability, industry positioning, size and risk profile.
This Fair Ratio is more tailored than a simple comparison to peers or industry averages, because it adjusts for company level factors rather than assuming one size fits all. Set against that benchmark, Vistra’s current PE of 58.17x sits noticeably higher than the 46.86x Fair Ratio, suggesting the market is pricing in more optimism than the fundamentals alone would support.
Result: OVERVALUED
PE ratios tell one story, but what if the real opportunity lies elsewhere? Discover 1450 companies where insiders are betting big on explosive growth.
Upgrade Your Decision Making: Choose your Vistra Narrative
Earlier we mentioned that there is an even better way to understand valuation, so let us introduce you to Narratives, a simple way to connect your view of Vistra’s story with a financial forecast and a fair value estimate you can actually act on. A Narrative is your investment storyline for the company, where you spell out what you believe about its future revenue, earnings and margins, and the platform then converts that story into a forecast and a fair value. On Simply Wall St, Narratives sit inside the Community page and are used by millions of investors as an easy, visual tool to compare a company’s Fair Value to its current share price and decide whether it looks like a buy, a hold, or a sell. They also update dynamically when new information, like earnings or major contracts, comes in so your view stays current without constant manual tweaking. For Vistra, one investor might build a bullish Narrative around accelerating AI driven power demand and arrive at a Fair Value near $261 per share, while a more cautious investor, focused on regulatory and execution risks, could land closer to $164.53, and both perspectives are made transparent through their numbers.
Do you think there's more to the story for Vistra? Head over to our Community to see what others are saying!
This article by Simply Wall St is general in nature. We provide commentary based on historical data and analyst forecasts only using an unbiased methodology and our articles are not intended to be financial advice. It does not constitute a recommendation to buy or sell any stock, and does not take account of your objectives, or your financial situation. We aim to bring you long-term focused analysis driven by fundamental data. Note that our analysis may not factor in the latest price-sensitive company announcements or qualitative material. Simply Wall St has no position in any stocks mentioned.
Have feedback on this article? Concerned about the content? Get in touch with us directly. Alternatively, email editorial-team@simplywallst.com