
Ensign Group (ENSG): Assessing Valuation After a Strong Multi‑Year Run and Recent Share Price Pullback
Ensign Group (ENSG) has quietly outperformed many healthcare peers this year, so the stock now invites a closer look at whether its strong long term returns still leave room for further upside.
See our latest analysis for Ensign Group.
Recent trading has cooled slightly, with a modest pullback from recent highs even as Ensign holds near $174.14. However, the 90 day share price return and multi year total shareholder returns still point to sustained momentum rather than a reversal.
If Ensign’s run has you rethinking your healthcare exposure, this is a good moment to scan healthcare stocks and see what other operators are starting to stand out.
With double digit earnings growth and the stock still trading at a discount to analyst targets and intrinsic value estimates, is Ensign quietly offering a fresh entry point, or is the market already pricing in years of expansion?
Price to Earnings of 30.5x, is it justified?
Ensign Group trades at $174.14, and that price currently bakes in a rich premium when measured against its earnings and peers.
The price to earnings ratio compares what investors pay today for each dollar of current earnings, and it is especially important for profitable, steadily growing operators like Ensign. A higher multiple often signals that the market expects durable earnings growth and resilient margins rather than a short lived spike.
At 30.5 times earnings, Ensign sits well above both its own estimated fair price to earnings ratio of 25.8 times and the broader US Healthcare sector’s 22.1 times, with peer companies closer to 18.1 times. That means the market is assigning Ensign a clear quality and growth premium, but it also suggests there is room for that multiple to compress toward a fairer level if execution or sentiment cools.
Explore the SWS fair ratio for Ensign Group
Result: Price to Earnings of 30.5x (OVERVALUED)
However, investors should watch for slower reimbursement growth or weaker acquisition returns, as either could challenge today’s premium multiple and long term growth assumptions.
Find out about the key risks to this Ensign Group narrative.
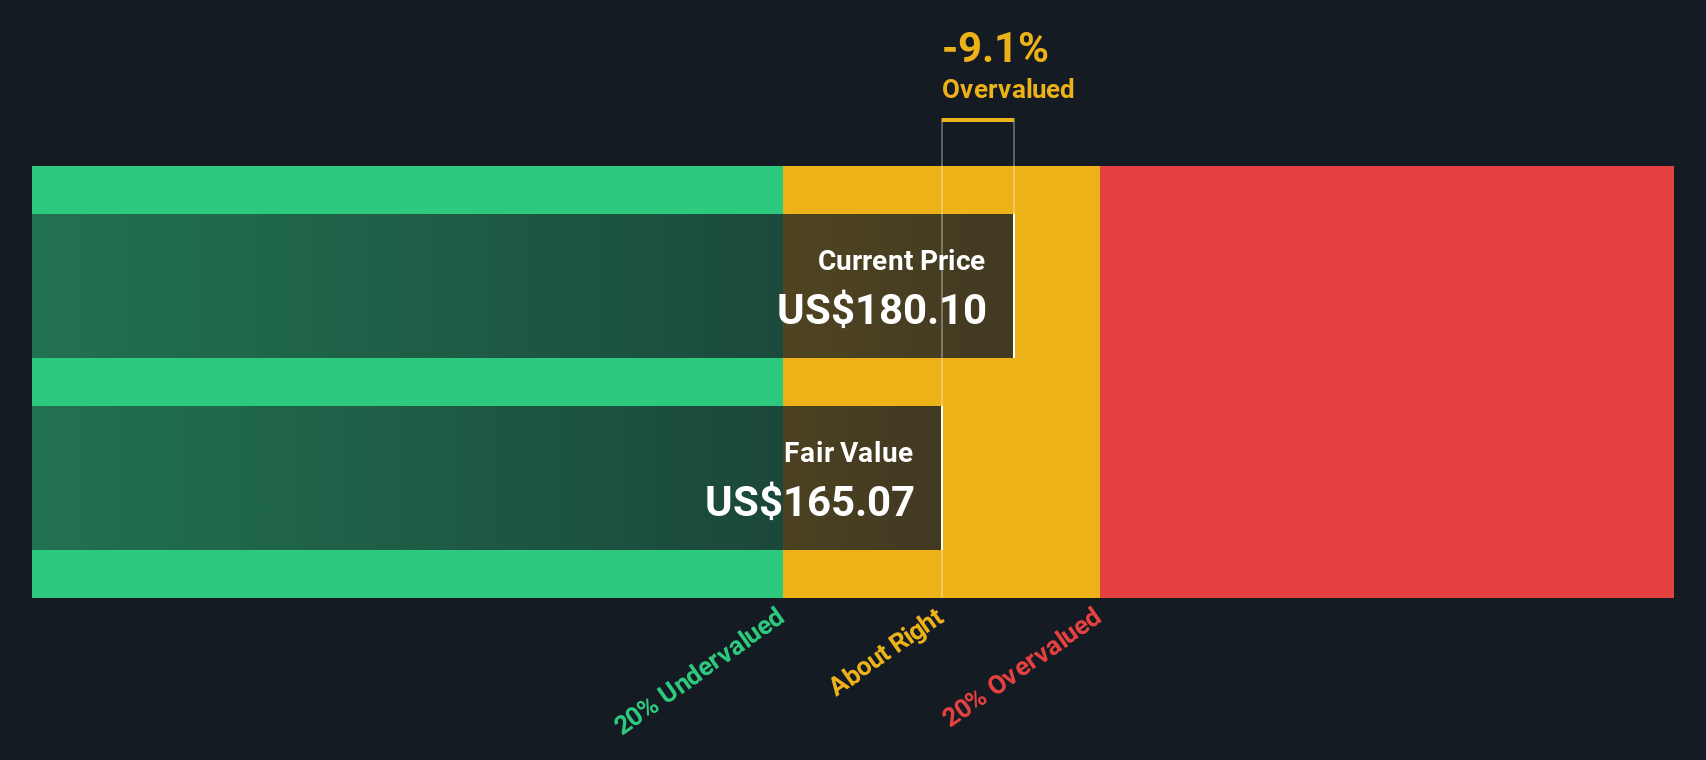
Another View: what does our DCF say?
While Ensign looks expensive on a 30.5 times earnings multiple, our DCF model tells a different story, suggesting the shares are trading around 15.9% below fair value. If cash flows are closer to the truth than today’s multiple, is the market underestimating the runway here?
Look into how the SWS DCF model arrives at its fair value.
Simply Wall St performs a discounted cash flow (DCF) on every stock in the world every day (check out Ensign Group for example). We show the entire calculation in full. You can track the result in your watchlist or portfolio and be alerted when this changes, or use our stock screener to discover 903 undervalued stocks based on their cash flows. If you save a screener we even alert you when new companies match - so you never miss a potential opportunity.
Build Your Own Ensign Group Narrative
If you would rather challenge these assumptions and dig into the numbers yourself, you can build a personal investment story in just a few minutes: Do it your way.
A good starting point is our analysis highlighting 3 key rewards investors are optimistic about regarding Ensign Group.
Looking for more investment ideas?
Ensign might be compelling today, but you will give yourself a real edge by systematically scanning fresh opportunities before the crowd moves in.
- Capture potential mispricings by targeting these 903 undervalued stocks based on cash flows that pair solid cash flows with compelling entry points.
- Ride the next wave of innovation by focusing on these 27 AI penny stocks positioned at the front line of intelligent automation.
- Strengthen your income stream by zeroing in on these 15 dividend stocks with yields > 3% that can help support long term total returns.
This article by Simply Wall St is general in nature. We provide commentary based on historical data and analyst forecasts only using an unbiased methodology and our articles are not intended to be financial advice. It does not constitute a recommendation to buy or sell any stock, and does not take account of your objectives, or your financial situation. We aim to bring you long-term focused analysis driven by fundamental data. Note that our analysis may not factor in the latest price-sensitive company announcements or qualitative material. Simply Wall St has no position in any stocks mentioned.
Have feedback on this article? Concerned about the content? Get in touch with us directly. Alternatively, email editorial-team@simplywallst.com