
Has Barclays Rally Run Its Course After 65% YTD Surge and Strong Valuation Signals?
- If you are wondering whether Barclays is still good value after such a strong run, or if most of the upside is already priced in, you are not alone. This is exactly what we will unpack here.
- The stock has climbed 0.8% over the last week, 8.7% over the last month, and an impressive 64.9% year to date. That caps a huge 71.0% gain over 1 year and 261.2% over 5 years, which naturally shifts how investors think about risk and reward.
- Recent moves have come as markets reassess UK banks in light of shifting interest rate expectations and a more constructive outlook for the domestic economy. This tends to support profitability for lenders like Barclays. At the same time, ongoing strategic updates and cost discipline have helped bolster confidence that the bank can translate this backdrop into sustainable returns.
- Even after that rally, Barclays scores a 4/6 valuation check score for undervaluation on our framework, suggesting the market may still be underestimating parts of the story. Next we will walk through the main valuation methods investors use, then finish with a more holistic way to judge whether Barclays is genuinely cheap or fairly priced.
Approach 1: Barclays Excess Returns Analysis
The Excess Returns model evaluates how effectively a bank converts its equity base into profits above its cost of capital, then projects those surplus returns into the future to estimate fair value.
For Barclays, the starting point is a Book Value of £4.50 per share and a Stable EPS of £0.59 per share, based on weighted future Return on Equity estimates from 11 analysts. The bank has delivered an Average Return on Equity of 10.95%, above its estimated Cost of Equity of £0.45 per share. That gap creates an Excess Return of £0.14 per share, which the model assumes can be sustained on a growing equity base.
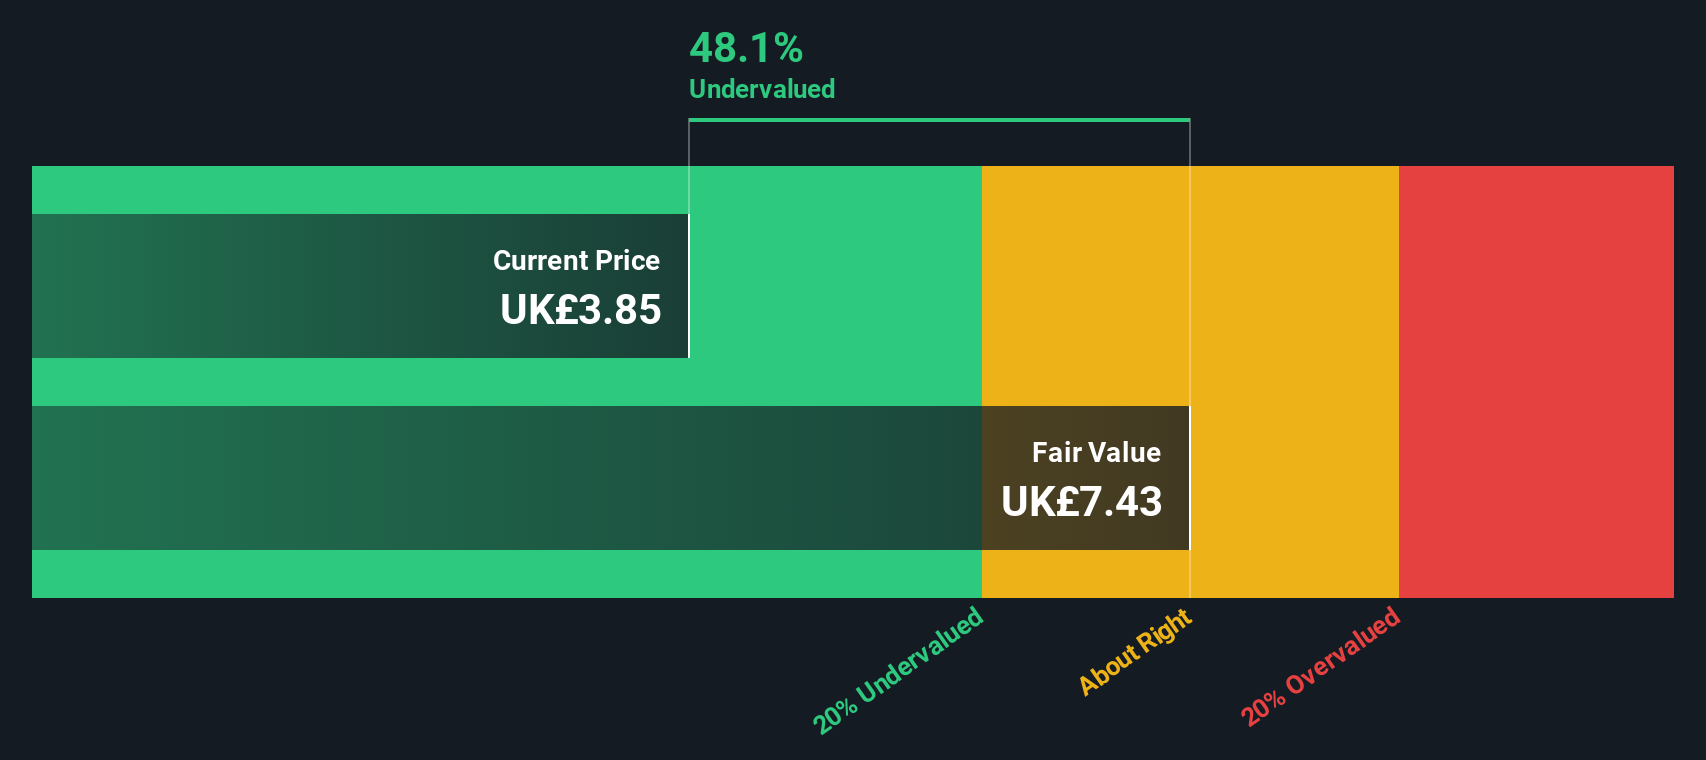
Analysts also expect the Stable Book Value to rise to £5.39 per share, supported by projections from 8 analysts. Using these inputs in the Excess Returns framework produces an intrinsic value of about £7.87 per share, which indicates the stock is approximately 44.1% undervalued relative to the current market price.
This suggests a business earning more than its cost of capital, with the market not fully reflecting those returns in the share price.
Result: UNDERVALUED
Our Excess Returns analysis suggests Barclays is undervalued by 44.1%. Track this in your watchlist or portfolio, or discover 903 more undervalued stocks based on cash flows.
Approach 2: Barclays Price vs Earnings
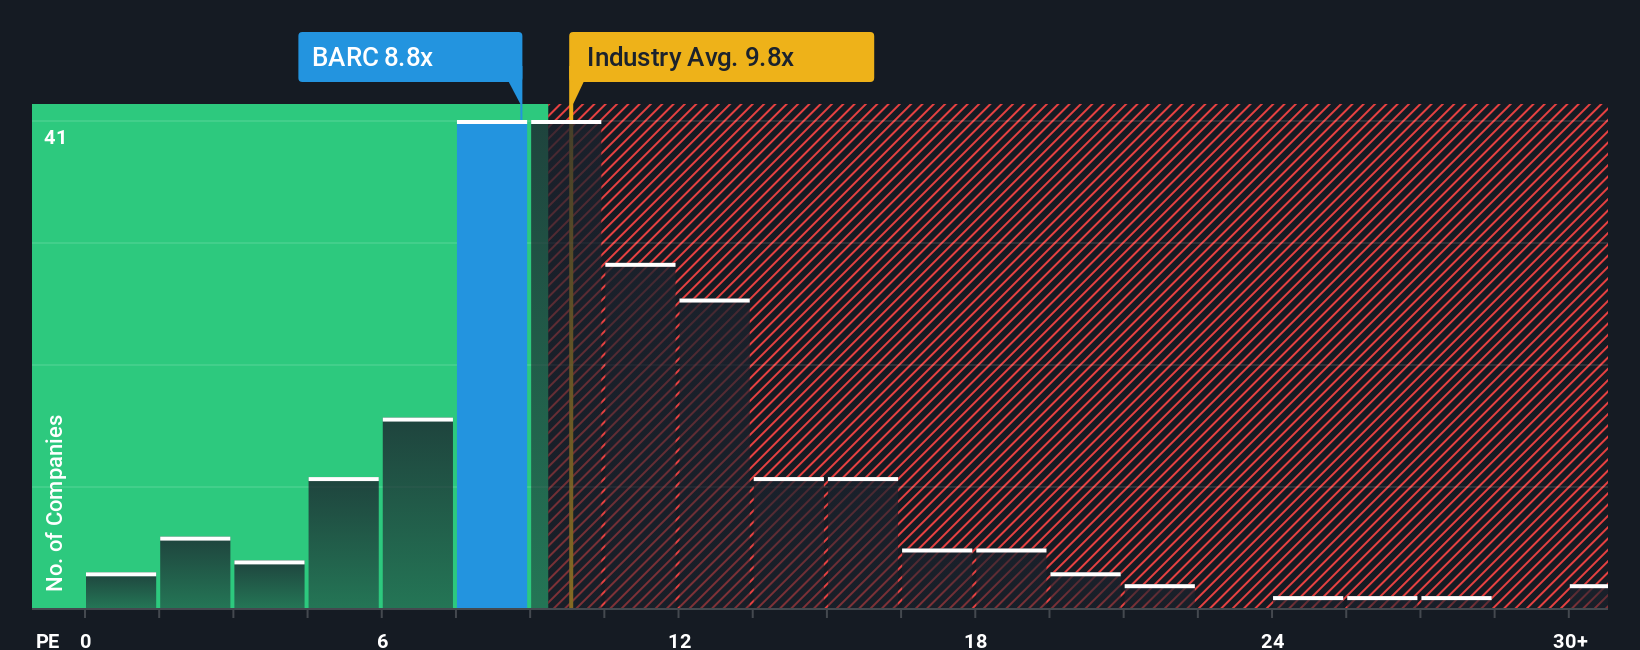
For a profitable bank like Barclays, the price to earnings ratio is a practical way to gauge whether investors are paying a reasonable price for each pound of current earnings. A higher PE usually reflects stronger growth expectations or lower perceived risk, while a lower PE can signal slower growth, higher risk, or a potential bargain if the market is too pessimistic.
Barclays currently trades on a PE of around 10.21x, slightly below the wider Banks industry average of 10.62x and meaningfully below the broader peer group average of 12.79x. On the surface, that discount hints at some value, but simple comparisons can miss important context about Barclays specific growth profile, profitability, and risk.
This is where Simply Wall St Fair Ratio comes in. It estimates what PE Barclays should trade on given its earnings growth outlook, industry, profit margins, market cap and risk factors. That Fair Ratio is 8.95x, which is a more tailored benchmark than blunt peer or sector averages. With the actual PE of 10.21x sitting modestly above this, the multiple suggests Barclays is trading at a mild premium to its fundamentals rather than a clear bargain.
Result: OVERVALUED
PE ratios tell one story, but what if the real opportunity lies elsewhere? Discover 1450 companies where insiders are betting big on explosive growth.
Upgrade Your Decision Making: Choose your Barclays Narrative
Earlier we mentioned that there is an even better way to understand valuation, so let us introduce you to Narratives, a simple way to attach a story, your view on Barclays future revenue, earnings and margins, to a financial forecast that leads to your own fair value. On Simply Wall St, within the Community page used by millions of investors, you can pick or build a Narrative that clearly links Barclays business story, for example growing digital banking and UK retail exposure or facing tougher competition and regulatory pressure, to explicit forecasts and a fair value, then compare that fair value to the current share price to decide whether it looks like a buy, hold, or sell. These Narratives update dynamically as new information such as news, earnings, or guidance is released, so your fair value view evolves with the facts. For Barclays right now, some investors might back a bullish Narrative closer to a £4.55 fair value, while more cautious investors might align with a bearish view nearer £3.06, and Narratives make those perspectives, and the assumptions behind them, completely transparent and easy to compare.
Do you think there's more to the story for Barclays? Head over to our Community to see what others are saying!

This article by Simply Wall St is general in nature. We provide commentary based on historical data and analyst forecasts only using an unbiased methodology and our articles are not intended to be financial advice. It does not constitute a recommendation to buy or sell any stock, and does not take account of your objectives, or your financial situation. We aim to bring you long-term focused analysis driven by fundamental data. Note that our analysis may not factor in the latest price-sensitive company announcements or qualitative material. Simply Wall St has no position in any stocks mentioned.
Have feedback on this article? Concerned about the content? Get in touch with us directly. Alternatively, email editorial-team@simplywallst.com