
Is It Too Late to Consider Loblaw After Its Strong Multi Year Share Price Rally?
- If you are wondering whether Loblaw Companies is still a bargain after its long run up, or if new buyers are late to the party, this breakdown is designed to help you decide using numbers rather than noise.
- The stock has cooled slightly in the last week with a -0.5% move, but that follows a strong 8.5% rise over 30 days and gains of 29.2% year to date, 29.0% over 1 year, 105.8% over 3 years, and 302.5% over 5 years.
- Recent headlines have focused on Loblaw's role in Canada’s cost of living conversation and regulatory scrutiny around grocery pricing, which can influence how investors view its long term pricing power and political risk. At the same time, the company has been noted for ongoing shareholder friendly moves such as buybacks and dividends, reinforcing its image as a steady compounder rather than a speculative play.
- Despite that track record, Loblaw scores just 0/6 on our valuation checks. In this article, we unpack what traditional valuation methods say, where they fall short, and then outline a more nuanced way to judge whether the market is mispricing this stock.
Loblaw Companies scores just 0/6 on our valuation checks. See what other red flags we found in the full valuation breakdown.
Approach 1: Loblaw Companies Discounted Cash Flow (DCF) Analysis
A Discounted Cash Flow, or DCF, estimates what a business is worth by projecting the cash it can generate in the future and then discounting those cash flows back to today’s value.
For Loblaw Companies, the model starts with last twelve months free cash flow of about CA$3.49 billion and then applies a two stage Free Cash Flow to Equity approach. Analyst forecasts drive the first few years, with free cash flow expected to be around CA$2.63 billion by 2027. Beyond that, Simply Wall St extrapolates cash flows out to 2035, gradually slowing growth so it reflects a more mature retailer profile rather than a high growth story.
Adding up all those discounted cash flows results in an estimated intrinsic value of roughly CA$42.83 per share. Compared with the current share price, the DCF implies the stock is about 43.4% above what the cash flow projections justify, suggesting investors are paying a premium for Loblaw’s stability and market position rather than its modeled cash generation alone.
Result: OVERVALUED
Our Discounted Cash Flow (DCF) analysis suggests Loblaw Companies may be overvalued by 43.4%. Discover 903 undervalued stocks or create your own screener to find better value opportunities.

Approach 2: Loblaw Companies Price vs Earnings
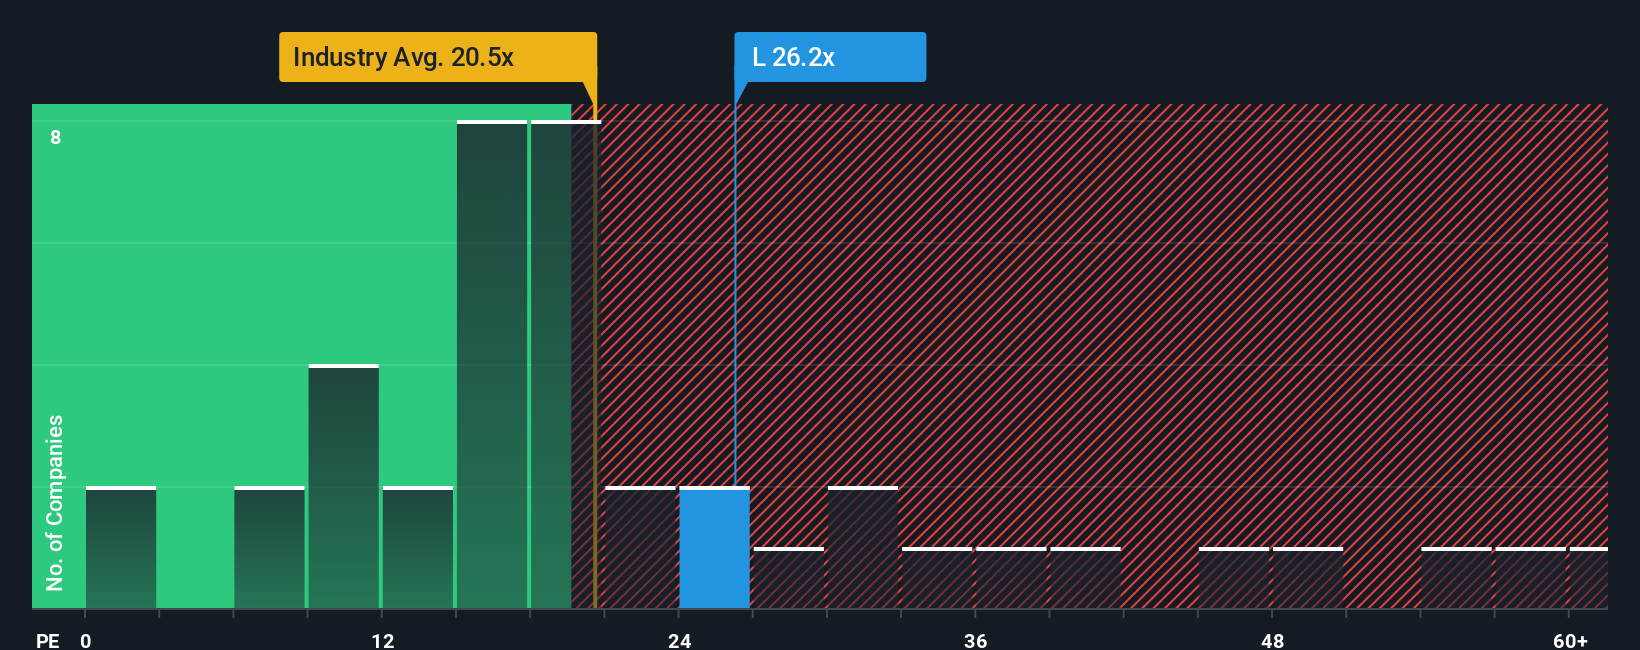
For a mature, consistently profitable retailer like Loblaw, the Price to Earnings, or PE, ratio is a natural starting point because it connects what investors pay with the earnings the business actually produces. A higher PE can be justified when investors expect faster growth or see the earnings as particularly reliable. In contrast, slower growth or higher risk usually calls for a lower, more conservative multiple.
Loblaw currently trades on a PE of about 29.3x, which is notably richer than both the Consumer Retailing industry average of roughly 17.4x and the broader peer group at around 20.2x. Simply Wall St’s proprietary Fair Ratio for Loblaw, however, is 25.1x. This metric estimates what a reasonable PE should be after factoring in the company’s earnings growth outlook, margins, risk profile, industry dynamics and market cap. It is intended to serve as a more tailored yardstick than blunt comparisons with peers or the sector.
Set against this Fair Ratio of 25.1x, Loblaw’s 29.3x PE suggests investors are paying a premium above what its fundamentals alone might warrant.
Result: OVERVALUED
PE ratios tell one story, but what if the real opportunity lies elsewhere? Discover 1450 companies where insiders are betting big on explosive growth.
Upgrade Your Decision Making: Choose your Loblaw Companies Narrative
Earlier we mentioned that there is an even better way to understand valuation, so let us introduce you to Narratives, a simple framework on Simply Wall St’s Community page that lets you write the story you believe about a company, translate that story into assumptions for future revenue, earnings and margins, and then see the fair value that drops out of those forecasts. This allows you to easily compare it to today’s share price and consider whether to buy, hold or sell, with the numbers updating dynamically as new news or earnings arrive. For example, one Loblaw Narrative might lean bullish, focusing on margin expansion, automation and healthcare growth to justify a higher fair value near the most optimistic analyst target. Another might stress regulatory risk, competition and online disruption to support a much lower fair value closer to the most cautious target, showing clearly how different perspectives on the same business create very different price signals.
Do you think there's more to the story for Loblaw Companies? Head over to our Community to see what others are saying!

This article by Simply Wall St is general in nature. We provide commentary based on historical data and analyst forecasts only using an unbiased methodology and our articles are not intended to be financial advice. It does not constitute a recommendation to buy or sell any stock, and does not take account of your objectives, or your financial situation. We aim to bring you long-term focused analysis driven by fundamental data. Note that our analysis may not factor in the latest price-sensitive company announcements or qualitative material. Simply Wall St has no position in any stocks mentioned.
Have feedback on this article? Concerned about the content? Get in touch with us directly. Alternatively, email editorial-team@simplywallst.com