
Does Royal Gold’s 51% 2025 Surge Still Leave Room for Further Upside?
- If you are wondering whether Royal Gold’s rally still has room to run or if the stock is already priced for perfection, you are in the right place to unpack what the current share price really implies.
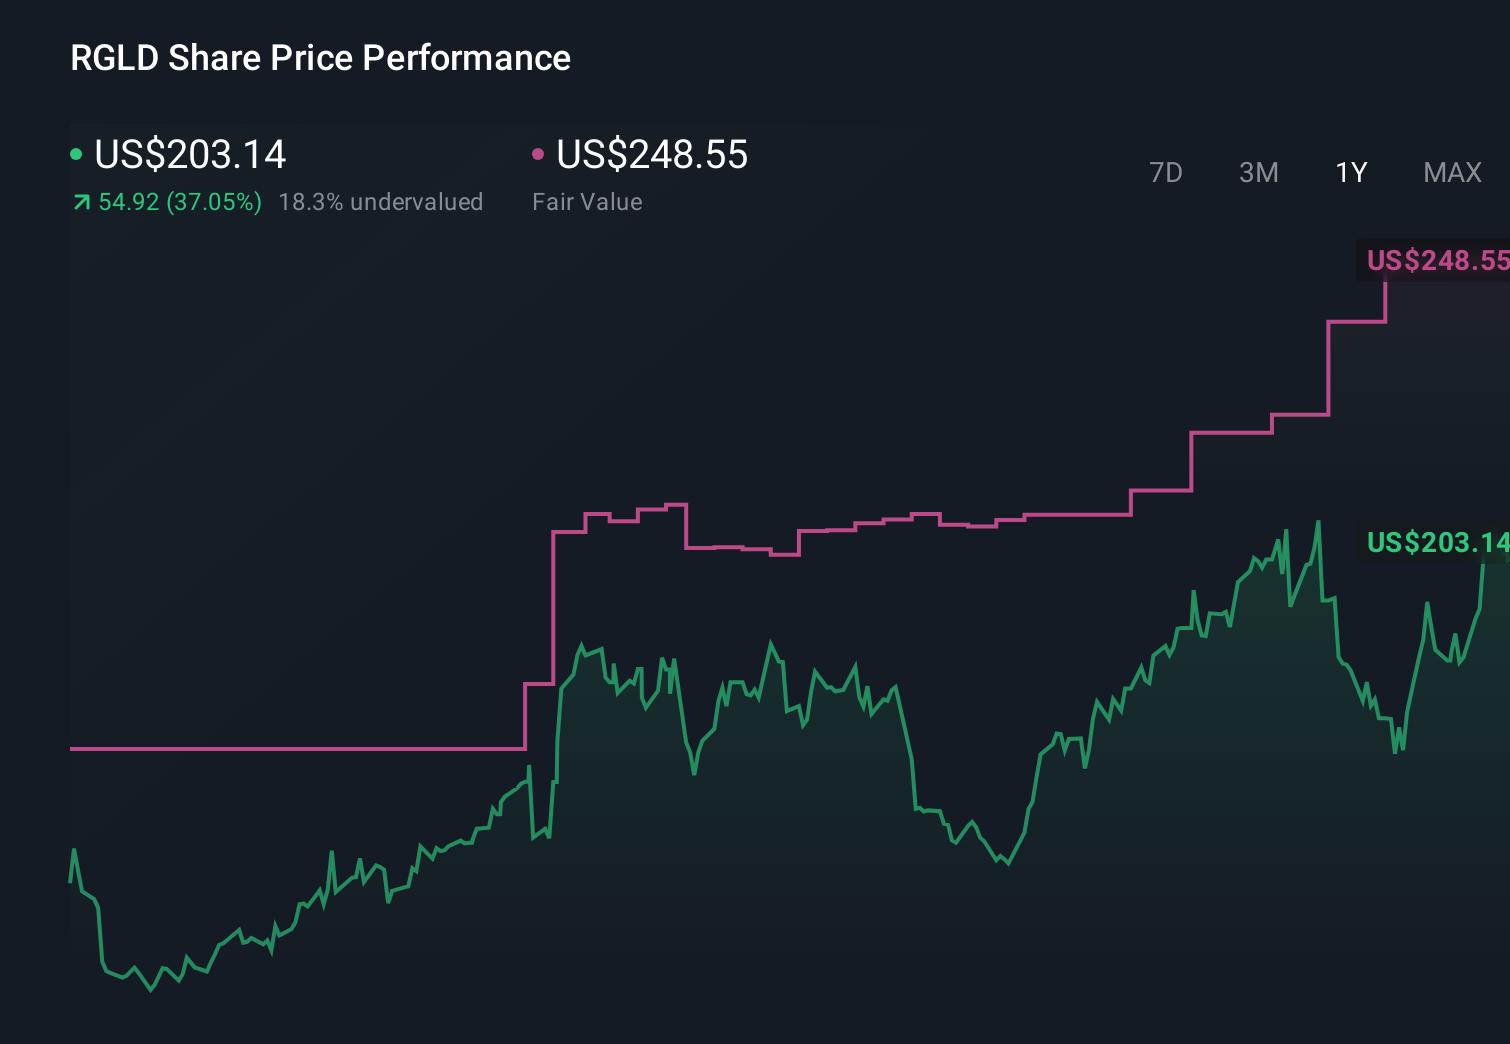
- After a strong climb to around $203, the stock is up 10.0% over the last month and roughly 51.0% year to date, with an 88.8% gain over 3 years and 95.4% over 5 years that has clearly caught investors’ attention.
- Those gains have come as investors have leaned back into gold royalty and streaming names as a way to gain exposure to higher and more volatile precious metal prices while avoiding some of the operational risk miners face. At the same time, a renewed focus on portfolio defensiveness and inflation hedges has pushed capital toward companies like Royal Gold that generate high margin, relatively predictable cash flows from long lived assets.
- Despite that backdrop, Royal Gold only scores 2 out of 6 on our undervaluation checks. In this article, we break down what different valuation methods indicate about the stock today and later return to an additional way of thinking about its true worth.
Royal Gold scores just 2/6 on our valuation checks. See what other red flags we found in the full valuation breakdown.
Approach 1: Royal Gold Discounted Cash Flow (DCF) Analysis
A Discounted Cash Flow model projects a company’s future cash flows and then discounts them back to today using a required return. This aims to estimate what the business is worth right now based on those cash flow projections.
For Royal Gold, the model uses a 2 Stage Free Cash Flow to Equity approach. It starts from last twelve month free cash flow of about $13.1 million and builds up to analyst and extrapolated forecasts. Analyst estimates and Simply Wall St extrapolations point to free cash flow rising to roughly $1.19 billion by 2035, with key waypoints such as about $1.07 billion in 2029. These projected cash flows are discounted back to today, all in $, to arrive at an intrinsic value per share.
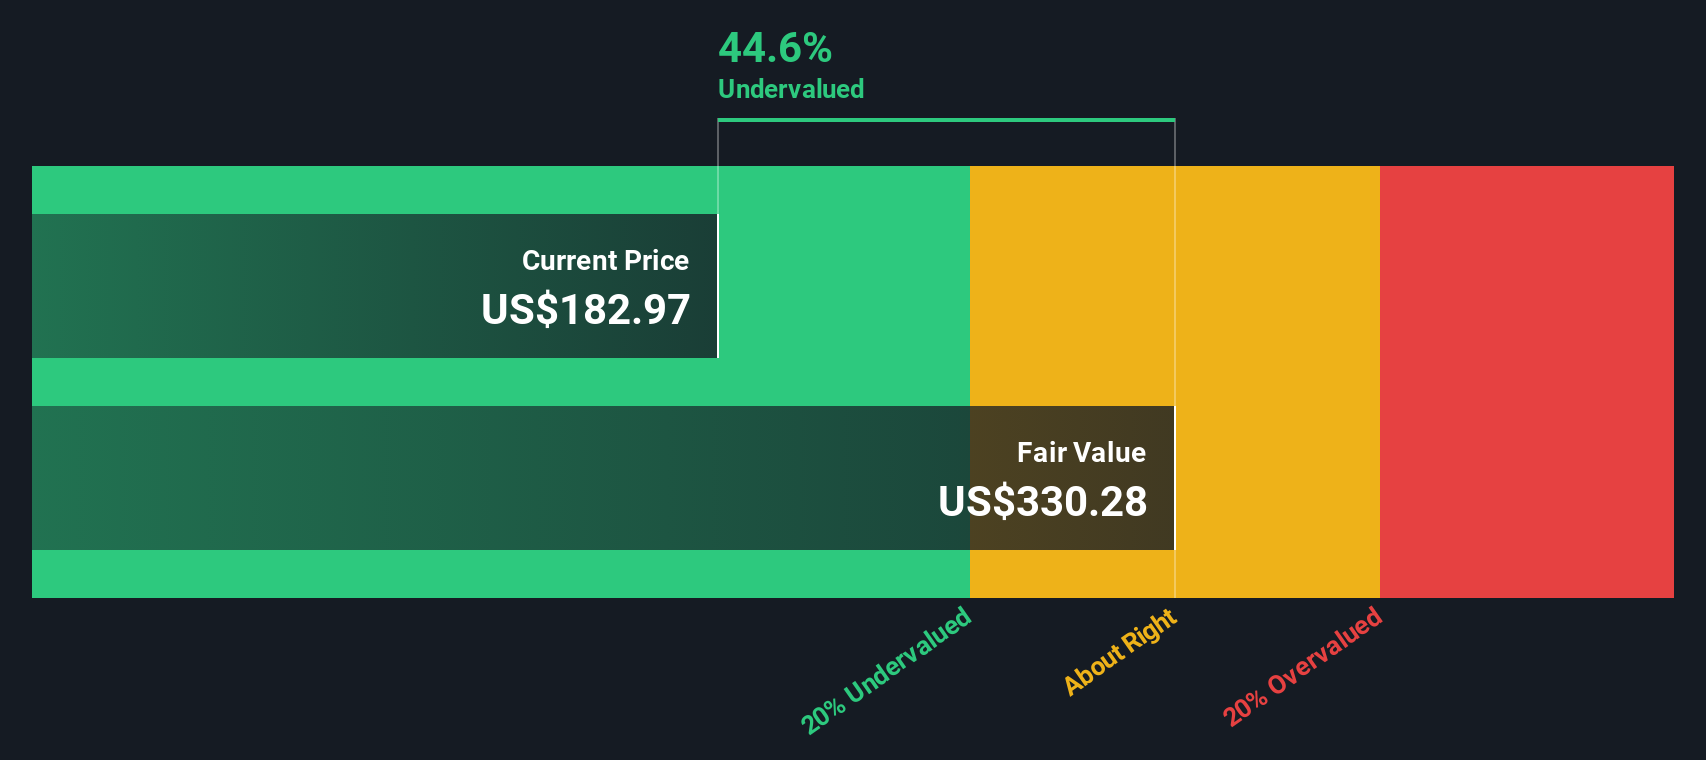
On this basis, Royal Gold’s DCF fair value is estimated at roughly $223.84 per share. Compared with the recent market price around $203, the model suggests the shares trade at about a 9.2% discount, implying only a modest margin of safety at current levels.
Result: ABOUT RIGHT
Royal Gold is fairly valued according to our Discounted Cash Flow (DCF), but this can change at a moment's notice. Track the value in your watchlist or portfolio and be alerted on when to act.
Approach 2: Royal Gold Price vs Earnings
For a profitable, relatively mature business like Royal Gold, the price to earnings ratio is a useful yardstick because it connects what investors pay today with the company’s current earnings power. In general, faster growth and lower perceived risk justify a higher PE, while slower growth, more cyclicality or higher risk typically warrant a lower multiple.
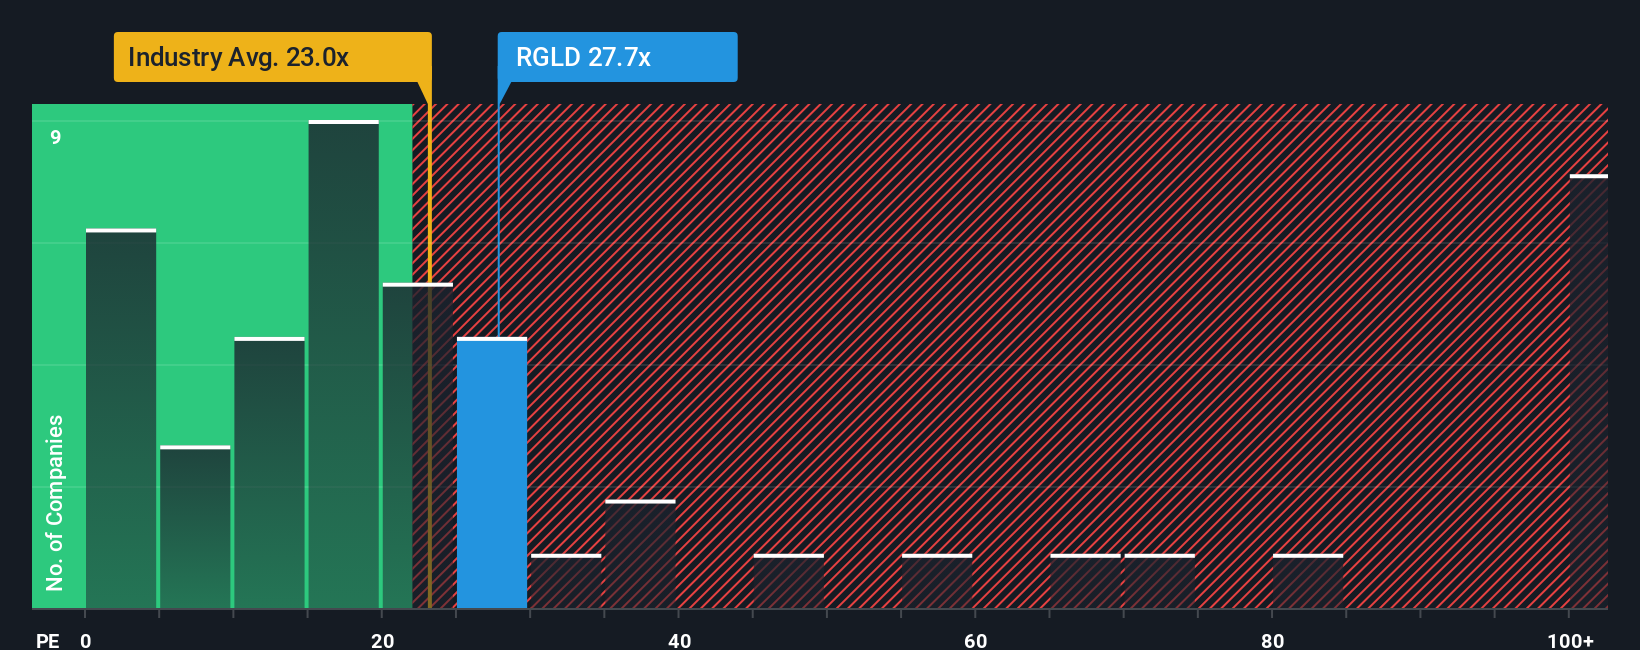
Royal Gold currently trades on about 35.7x earnings, well above both the Metals and Mining industry average of roughly 22.1x and the broader peer group average of around 20.7x. On those simple comparisons, the shares look expensive. However, Simply Wall St’s Fair Ratio framework goes a step further by estimating what a “normal” PE should be for Royal Gold, given its specific earnings growth outlook, profitability, industry positioning, market cap and risk profile. That Fair Ratio sits lower, at about 29.8x, and this implies the market is paying a premium even after accounting for those fundamentals.
Because Royal Gold’s actual PE of 35.7x is meaningfully above the Fair Ratio of 29.8x, the multiple based view suggests the stock is pricing in quite optimistic expectations.
Result: OVERVALUED
PE ratios tell one story, but what if the real opportunity lies elsewhere? Discover 1450 companies where insiders are betting big on explosive growth.
Upgrade Your Decision Making: Choose your Royal Gold Narrative
Earlier we mentioned that there is an even better way to understand valuation, so let us introduce you to Narratives, a simple tool on Simply Wall St’s Community page that lets you attach your own story about Royal Gold’s future revenue, earnings and margins to a financial forecast, turn that into a Fair Value, and then see in real time whether today’s share price looks high or low relative to your expectations. Each Narrative updates automatically as new news or earnings arrive. For example, one investor who believes recent acquisitions and strong precious metal demand will drive faster growth and justify a Fair Value near the most bullish target of about $237, while another worries about gold dependence, execution risk and leverage and pegs Fair Value closer to the most cautious target around $182, can both use their competing perspectives to decide, in a structured and transparent way, whether RGLD is attractive at its current price.
Do you think there's more to the story for Royal Gold? Head over to our Community to see what others are saying!
This article by Simply Wall St is general in nature. We provide commentary based on historical data and analyst forecasts only using an unbiased methodology and our articles are not intended to be financial advice. It does not constitute a recommendation to buy or sell any stock, and does not take account of your objectives, or your financial situation. We aim to bring you long-term focused analysis driven by fundamental data. Note that our analysis may not factor in the latest price-sensitive company announcements or qualitative material. Simply Wall St has no position in any stocks mentioned.
Have feedback on this article? Concerned about the content? Get in touch with us directly. Alternatively, email editorial-team@simplywallst.com