
Ekter (ATH:EKTER) rallies 11% this week, taking five-year gains to 667%
For many, the main point of investing in the stock market is to achieve spectacular returns. While the best companies are hard to find, but they can generate massive returns over long periods. To wit, the Ekter SA (ATH:EKTER) share price has soared 575% over five years. This just goes to show the value creation that some businesses can achieve. It's also good to see the share price up 31% over the last quarter. We love happy stories like this one. The company should be really proud of that performance!
The past week has proven to be lucrative for Ekter investors, so let's see if fundamentals drove the company's five-year performance.
There is no denying that markets are sometimes efficient, but prices do not always reflect underlying business performance. One way to examine how market sentiment has changed over time is to look at the interaction between a company's share price and its earnings per share (EPS).
During the five years of share price growth, Ekter moved from a loss to profitability. Sometimes, the start of profitability is a major inflection point that can signal fast earnings growth to come, which in turn justifies very strong share price gains. Since the company was unprofitable five years ago, but not three years ago, it's worth taking a look at the returns in the last three years, too. Indeed, the Ekter share price has gained 390% in three years. During the same period, EPS grew by 188% each year. This EPS growth is higher than the 70% average annual increase in the share price over the same three years. Therefore, it seems the market has moderated its expectations for growth, somewhat. This unenthusiastic sentiment is reflected in the stock's reasonably modest P/E ratio of 9.00.
You can see below how EPS has changed over time (discover the exact values by clicking on the image).
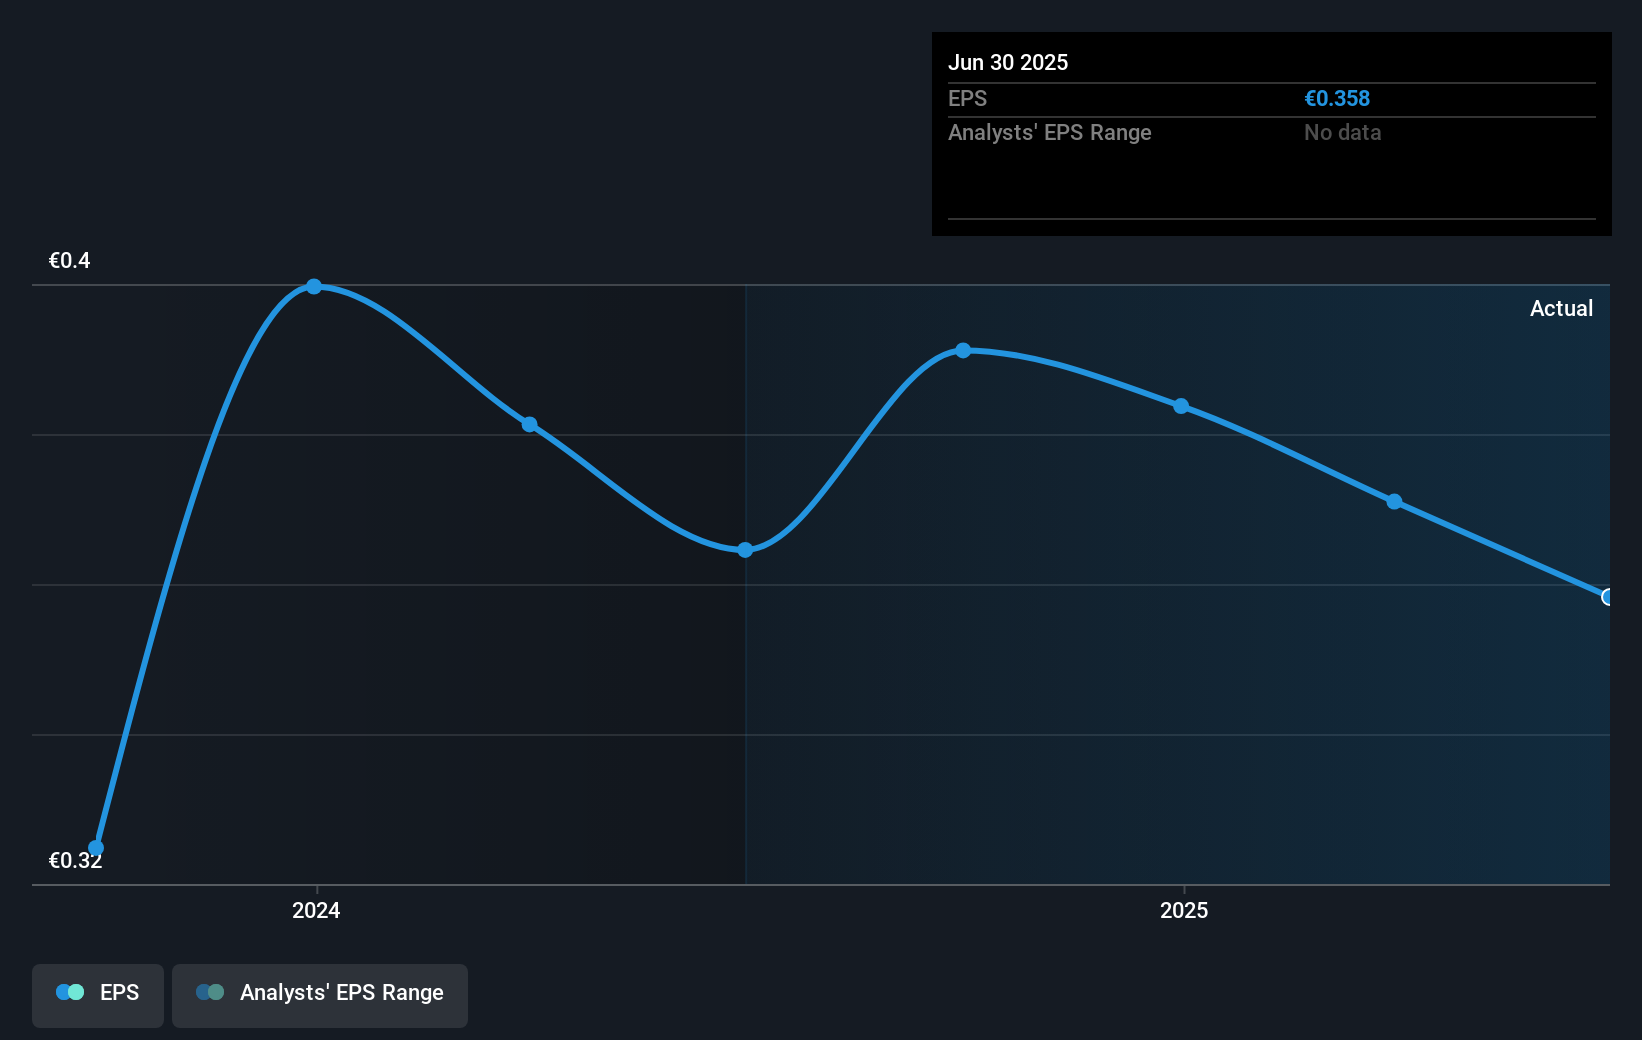
It might be well worthwhile taking a look at our free report on Ekter's earnings, revenue and cash flow.
What About Dividends?
When looking at investment returns, it is important to consider the difference between total shareholder return (TSR) and share price return. The TSR is a return calculation that accounts for the value of cash dividends (assuming that any dividend received was reinvested) and the calculated value of any discounted capital raisings and spin-offs. Arguably, the TSR gives a more comprehensive picture of the return generated by a stock. In the case of Ekter, it has a TSR of 667% for the last 5 years. That exceeds its share price return that we previously mentioned. And there's no prize for guessing that the dividend payments largely explain the divergence!
A Different Perspective
We're pleased to report that Ekter shareholders have received a total shareholder return of 118% over one year. And that does include the dividend. That's better than the annualised return of 50% over half a decade, implying that the company is doing better recently. In the best case scenario, this may hint at some real business momentum, implying that now could be a great time to delve deeper. It's always interesting to track share price performance over the longer term. But to understand Ekter better, we need to consider many other factors. For instance, we've identified 2 warning signs for Ekter (1 is significant) that you should be aware of.
But note: Ekter may not be the best stock to buy. So take a peek at this free list of interesting companies with past earnings growth (and further growth forecast).
Please note, the market returns quoted in this article reflect the market weighted average returns of stocks that currently trade on Greek exchanges.
Have feedback on this article? Concerned about the content? Get in touch with us directly. Alternatively, email editorial-team (at) simplywallst.com.
This article by Simply Wall St is general in nature. We provide commentary based on historical data and analyst forecasts only using an unbiased methodology and our articles are not intended to be financial advice. It does not constitute a recommendation to buy or sell any stock, and does not take account of your objectives, or your financial situation. We aim to bring you long-term focused analysis driven by fundamental data. Note that our analysis may not factor in the latest price-sensitive company announcements or qualitative material. Simply Wall St has no position in any stocks mentioned.