
Is It Too Late To Invest In Huntington Ingalls After Its 2025 Rally And Defense Wins?
- If you are wondering whether Huntington Ingalls Industries at around $315 a share is still good value after its run up, or if you are late to the party, this breakdown is for you.
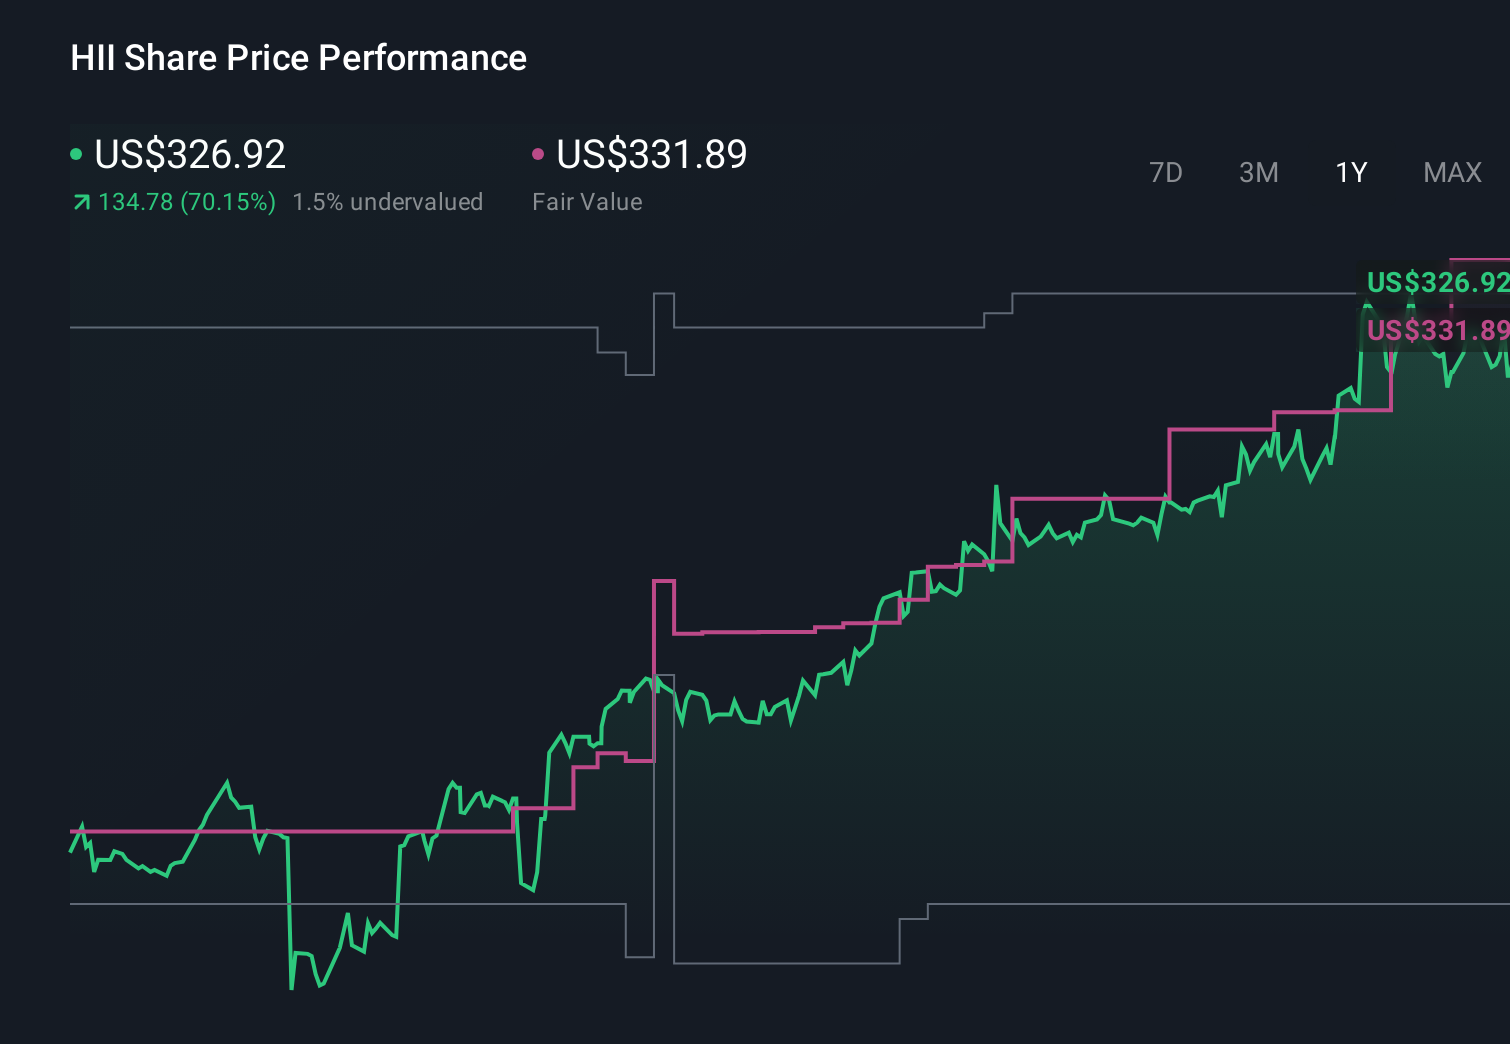
- The stock has climbed 67.9% year to date and 68.3% over the last 12 months, even after a 1.2% pullback over the past month and a 1.8% gain in the last week.
- Recent headlines have focused on Huntington Ingalls’ strategic wins in naval shipbuilding and defense modernization, underscoring its role as a key long term contractor for the U.S. government. At the same time, broader defense spending debates and geopolitical tensions are keeping investors focused on companies like HII that sit at the intersection of security and fiscal priorities.
- Despite the strong share price performance, valuation checks suggest Huntington Ingalls scores a 5/6 on value. Next, this analysis will walk through DCF, multiples, and asset based views, before finishing with a more intuitive way to think about what the market is really pricing in.
Approach 1: Huntington Ingalls Industries Discounted Cash Flow (DCF) Analysis
A Discounted Cash Flow model looks at the cash Huntington Ingalls Industries is expected to generate in the future and then discounts those projections back to today to estimate what the business is worth in dollars.
HII currently generates about $580.9 million in free cash flow, and analysts plus Simply Wall St projections see this rising steadily over the coming years. Forecasts point to free cash flow of roughly $617.2 million by 2026 and around $1.17 billion by 2035, with analyst estimates covering the nearer years and later numbers extrapolated using the 2 Stage Free Cash Flow to Equity approach.
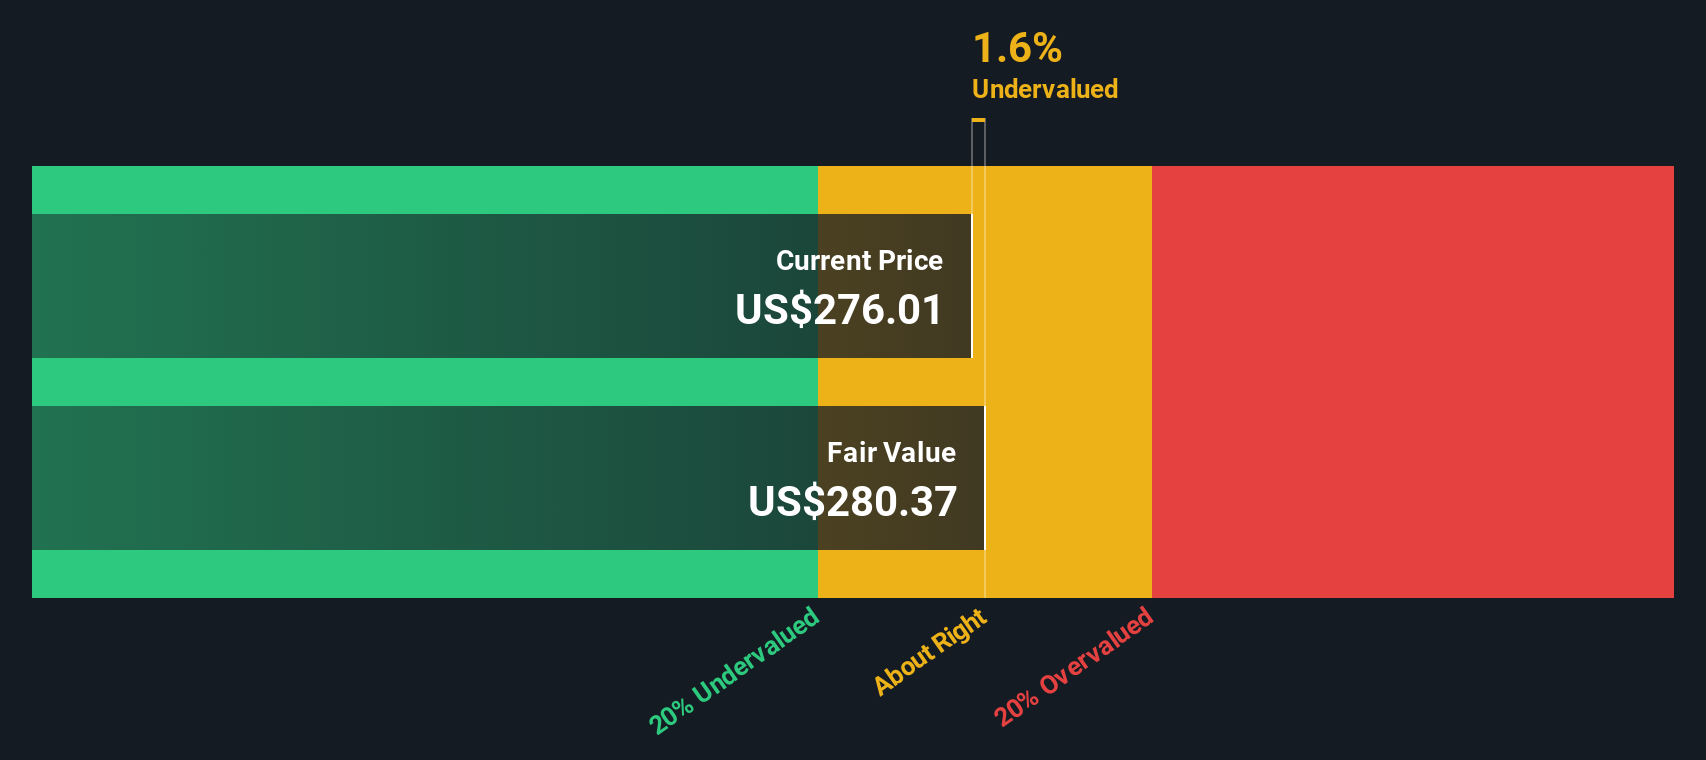
Adding up all those discounted future cash flows leads to an estimated intrinsic value of about $449.39 per share. Compared with a market price around $315, the DCF implies the stock is roughly 29.9% undervalued, suggesting the market is not fully pricing in HII’s cash generation potential based on these projections.
Result: UNDERVALUED
Our Discounted Cash Flow (DCF) analysis suggests Huntington Ingalls Industries is undervalued by 29.9%. Track this in your watchlist or portfolio, or discover 900 more undervalued stocks based on cash flows.
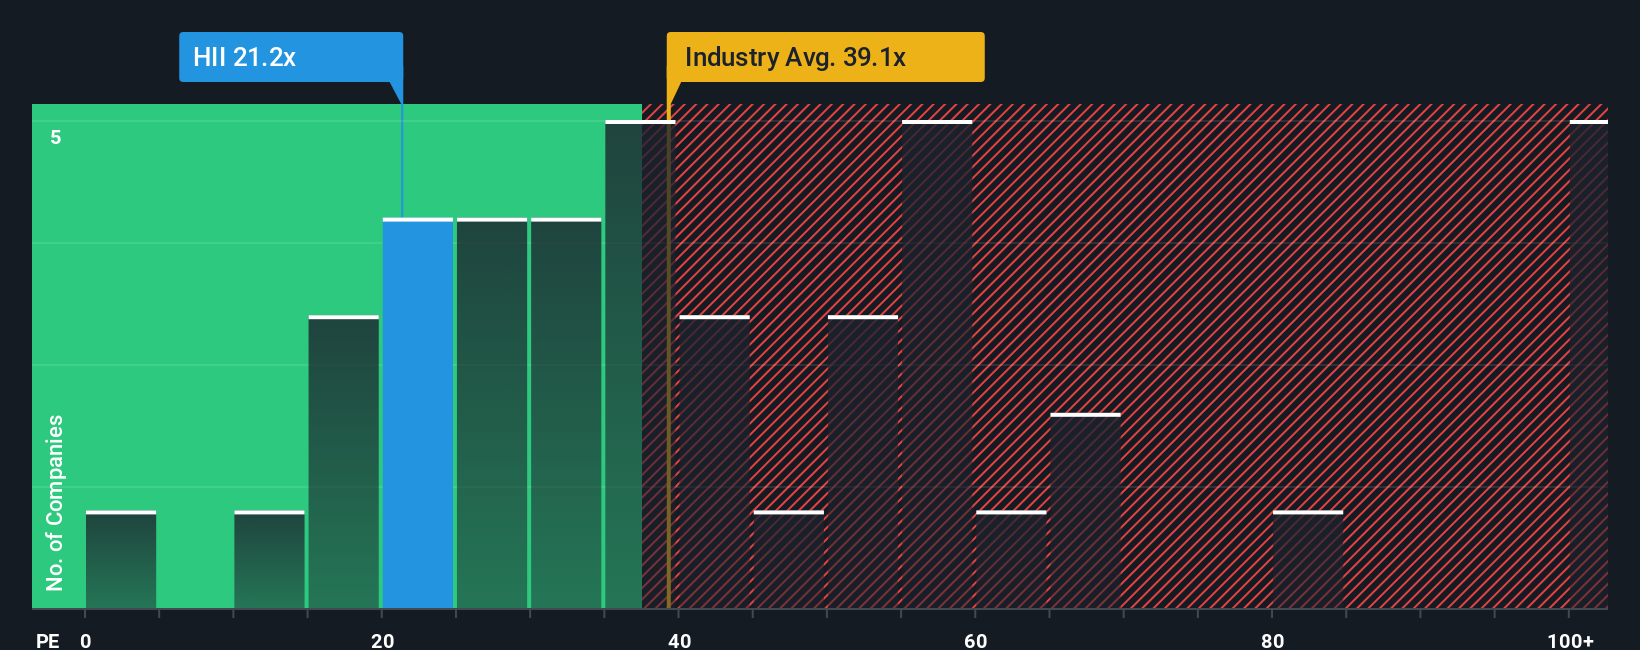
Approach 2: Huntington Ingalls Industries Price vs Earnings
For profitable, established businesses like Huntington Ingalls Industries, the price to earnings ratio is a useful yardstick because it links what investors are paying directly to the company’s current earnings power. In general, companies with stronger, more reliable growth and lower perceived risk can justify a higher PE multiple, while slower growing or riskier firms usually trade on lower multiples.
HII currently trades on a PE of about 21.7x, which is meaningfully below the broader Aerospace and Defense industry average of roughly 37.1x and also under the 34.3x average of its peer group. Simply Wall St’s Fair Ratio framework goes a step further by estimating what a “normal” PE should be for HII, given its specific mix of earnings growth, margins, size, industry dynamics and risk profile. This makes it more tailored than a simple peer or industry comparison, which can be skewed by very fast growers or structurally different businesses.
For HII, the Fair Ratio comes out at around 26.1x, modestly above the current 21.7x level. This indicates the market is pricing the stock at a discount to what its fundamentals might justify on this basis.
Result: UNDERVALUED
PE ratios tell one story, but what if the real opportunity lies elsewhere? Discover 1450 companies where insiders are betting big on explosive growth.
Upgrade Your Decision Making: Choose your Huntington Ingalls Industries Narrative
Earlier we mentioned that there is an even better way to understand valuation. Let us introduce you to Narratives, a simple tool on Simply Wall St’s Community page that lets you turn your view of Huntington Ingalls Industries into a story that links its business drivers to a financial forecast and then to a fair value. You can compare that fair value to today’s price, see whether your story suggests “buy”, “hold” or “sell”, and have it automatically update as new news or earnings are released. For example, one investor might build a bullish Narrative that assumes defense tailwinds, successful execution on the $56.9 billion backlog, rising margins to around 5.8 percent and a fair value comfortably above the current price. A more cautious investor might emphasize contract timing risks, labor pressures and a lower future PE near 18 times, leading to a more conservative fair value closer to the low analyst target range. Narratives makes it easy to see both perspectives side by side so you can decide which story you believe and how you want to approach the stock.
Do you think there's more to the story for Huntington Ingalls Industries? Head over to our Community to see what others are saying!
This article by Simply Wall St is general in nature. We provide commentary based on historical data and analyst forecasts only using an unbiased methodology and our articles are not intended to be financial advice. It does not constitute a recommendation to buy or sell any stock, and does not take account of your objectives, or your financial situation. We aim to bring you long-term focused analysis driven by fundamental data. Note that our analysis may not factor in the latest price-sensitive company announcements or qualitative material. Simply Wall St has no position in any stocks mentioned.
Have feedback on this article? Concerned about the content? Get in touch with us directly. Alternatively, email editorial-team@simplywallst.com